1. Pipeline to construct Mip-mining database
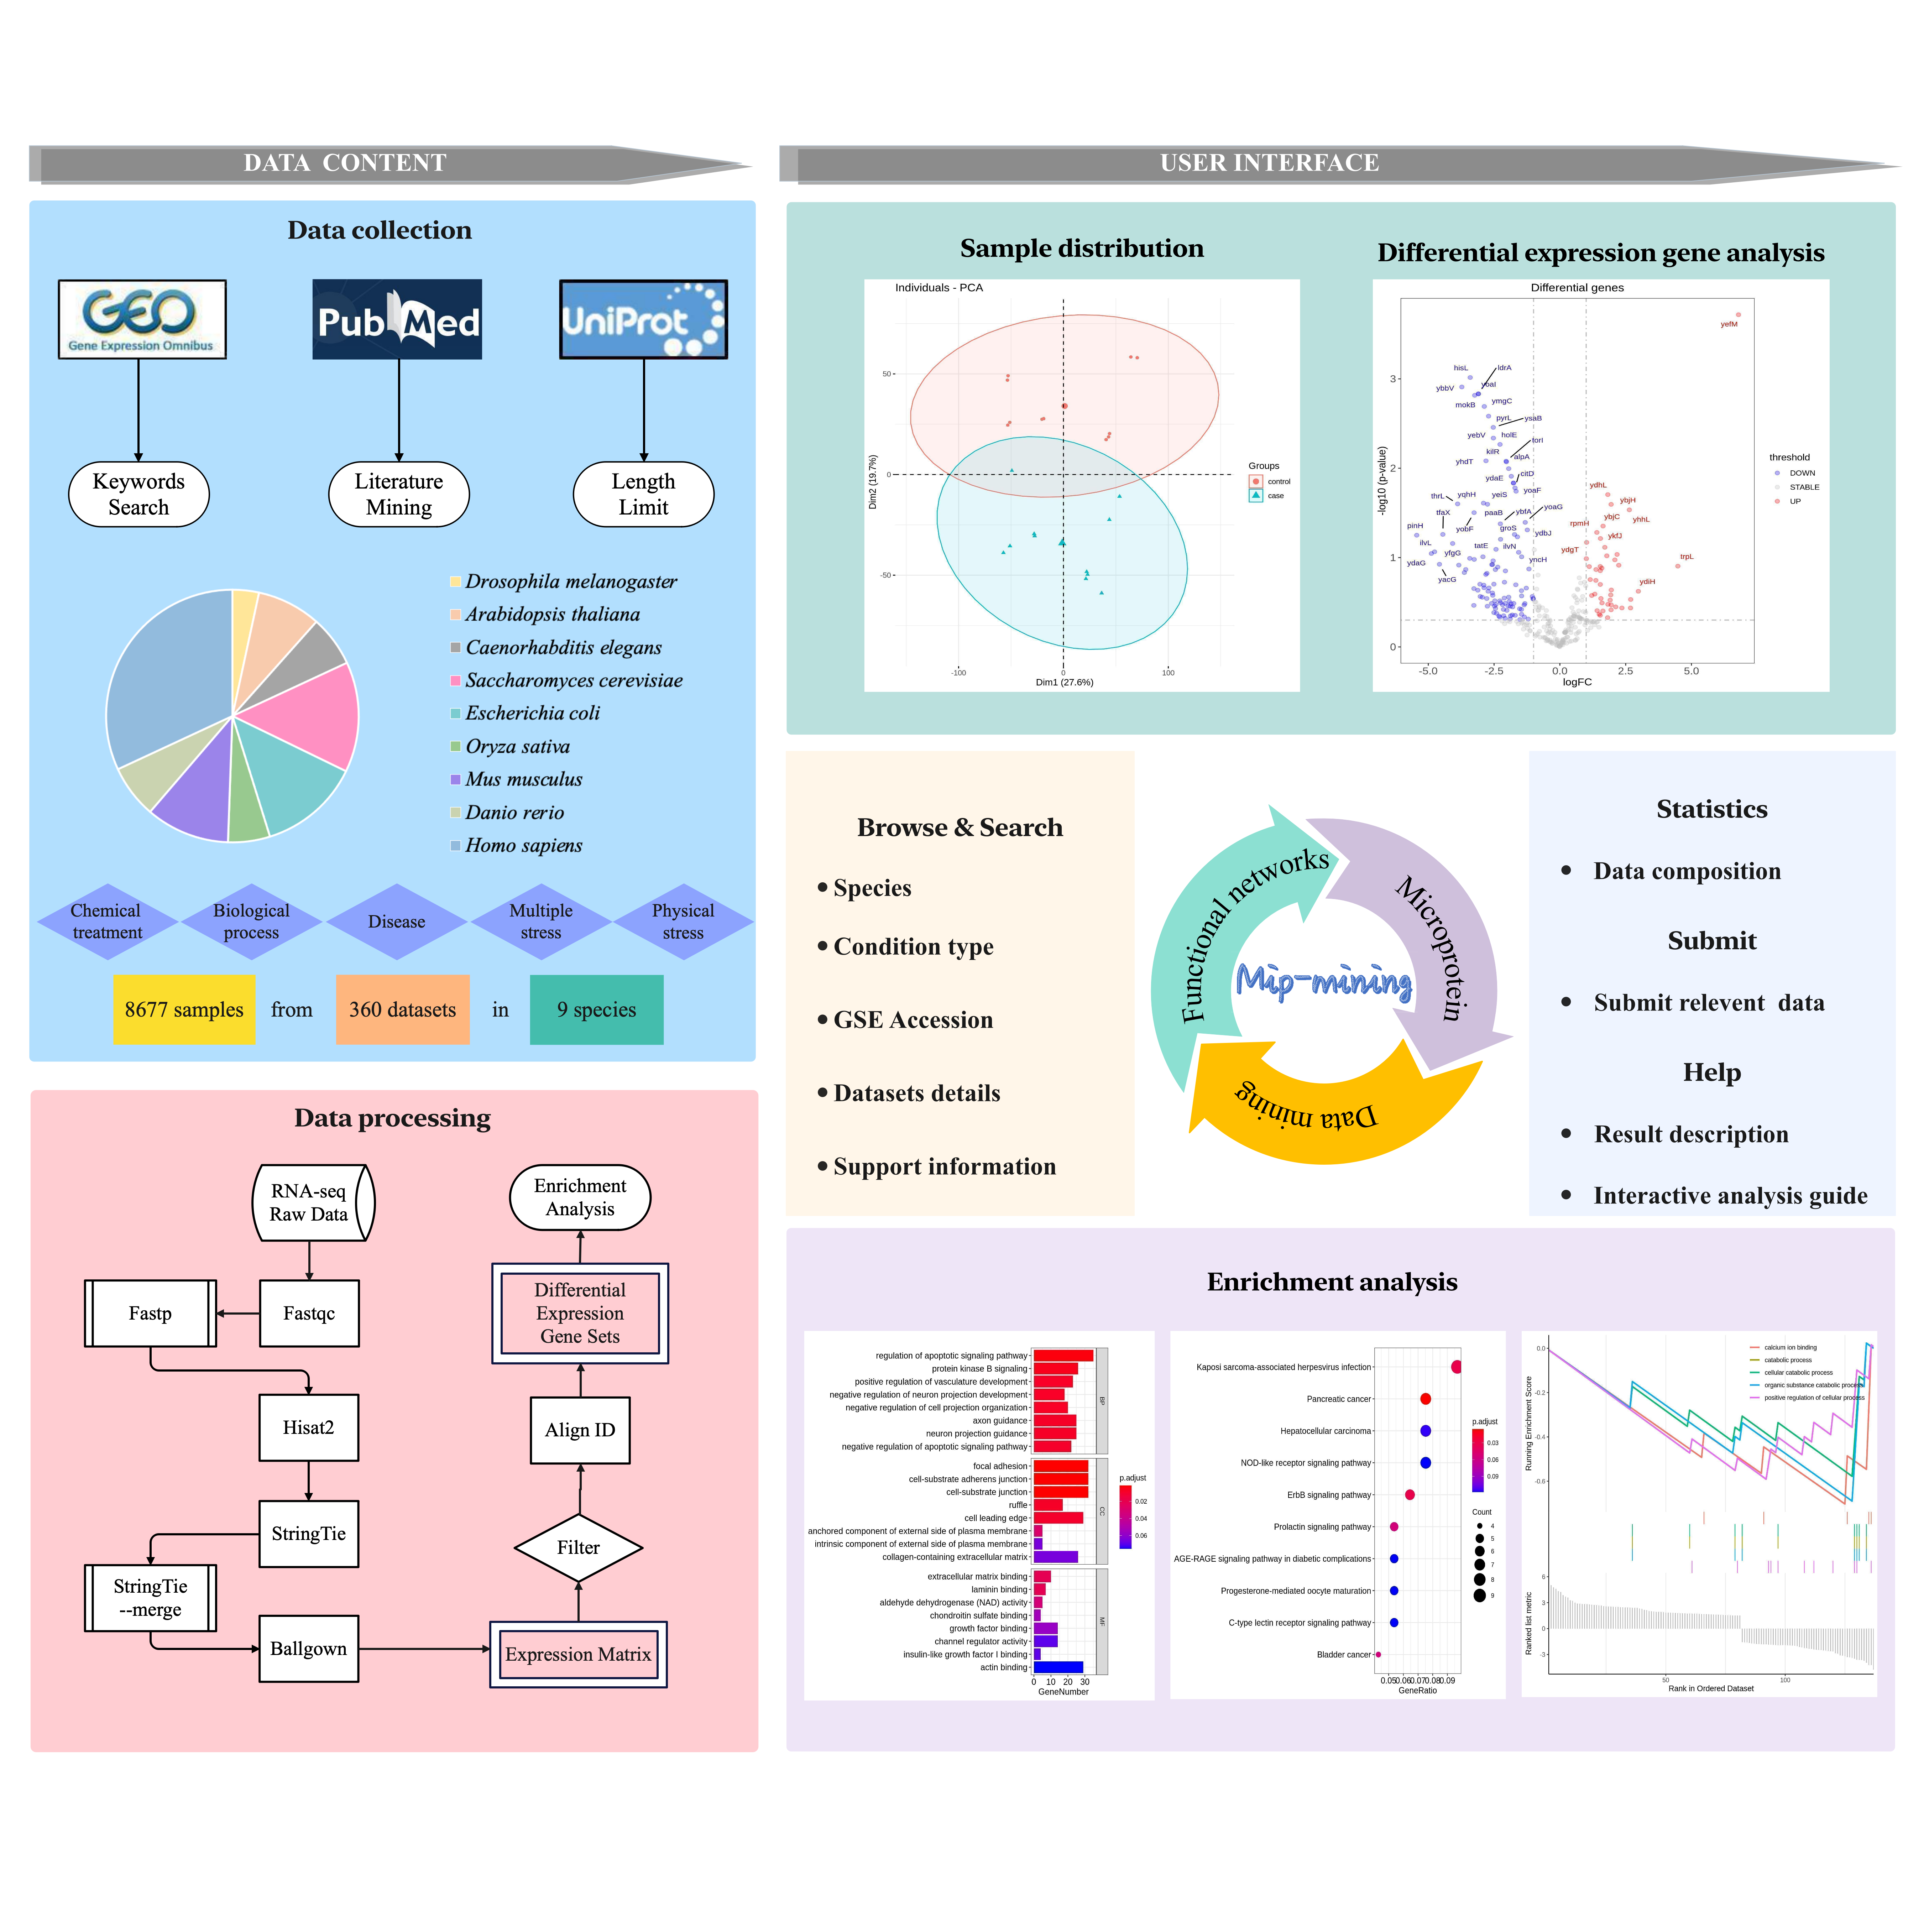
Figure 1. The overview workflow
Figure 1 above shows the construction pipeline for Mip-mining database. Firstly, collecting data from the GEO database with keywords searching, after a standardized RNA-seq analysis using Hisat2-stringTie-ballgown processing on HPC (High-Performance Computing), the differential expression matrix is obtained. Then R packages was used for searching differentially expressed genes enrichment analysis, and result visualization. All results can be downloaded. The Mip-mining database benefits establishment of the relationship between external and internal conditions (including environmental response and disease development) and differential expression of microproteins, and would be useful for mining the corresponding functions of microproteins.
2. How to browse in Mip-mining database?
In the web page for specific species (Figure 2.1), high-throughput transcriptome data of microproteins are listed with basic information including the GSE Accession of the RNA-seq data in the GEO database (column “GSE Accession”), the species’ name of data (column “Species”), the condition type of the experiment (column “Condition type”), the sample number of the data (column “Sample numbers”) and the data source of the RNA-seq data including GSE title with the corresponding link (column “GSE title”).
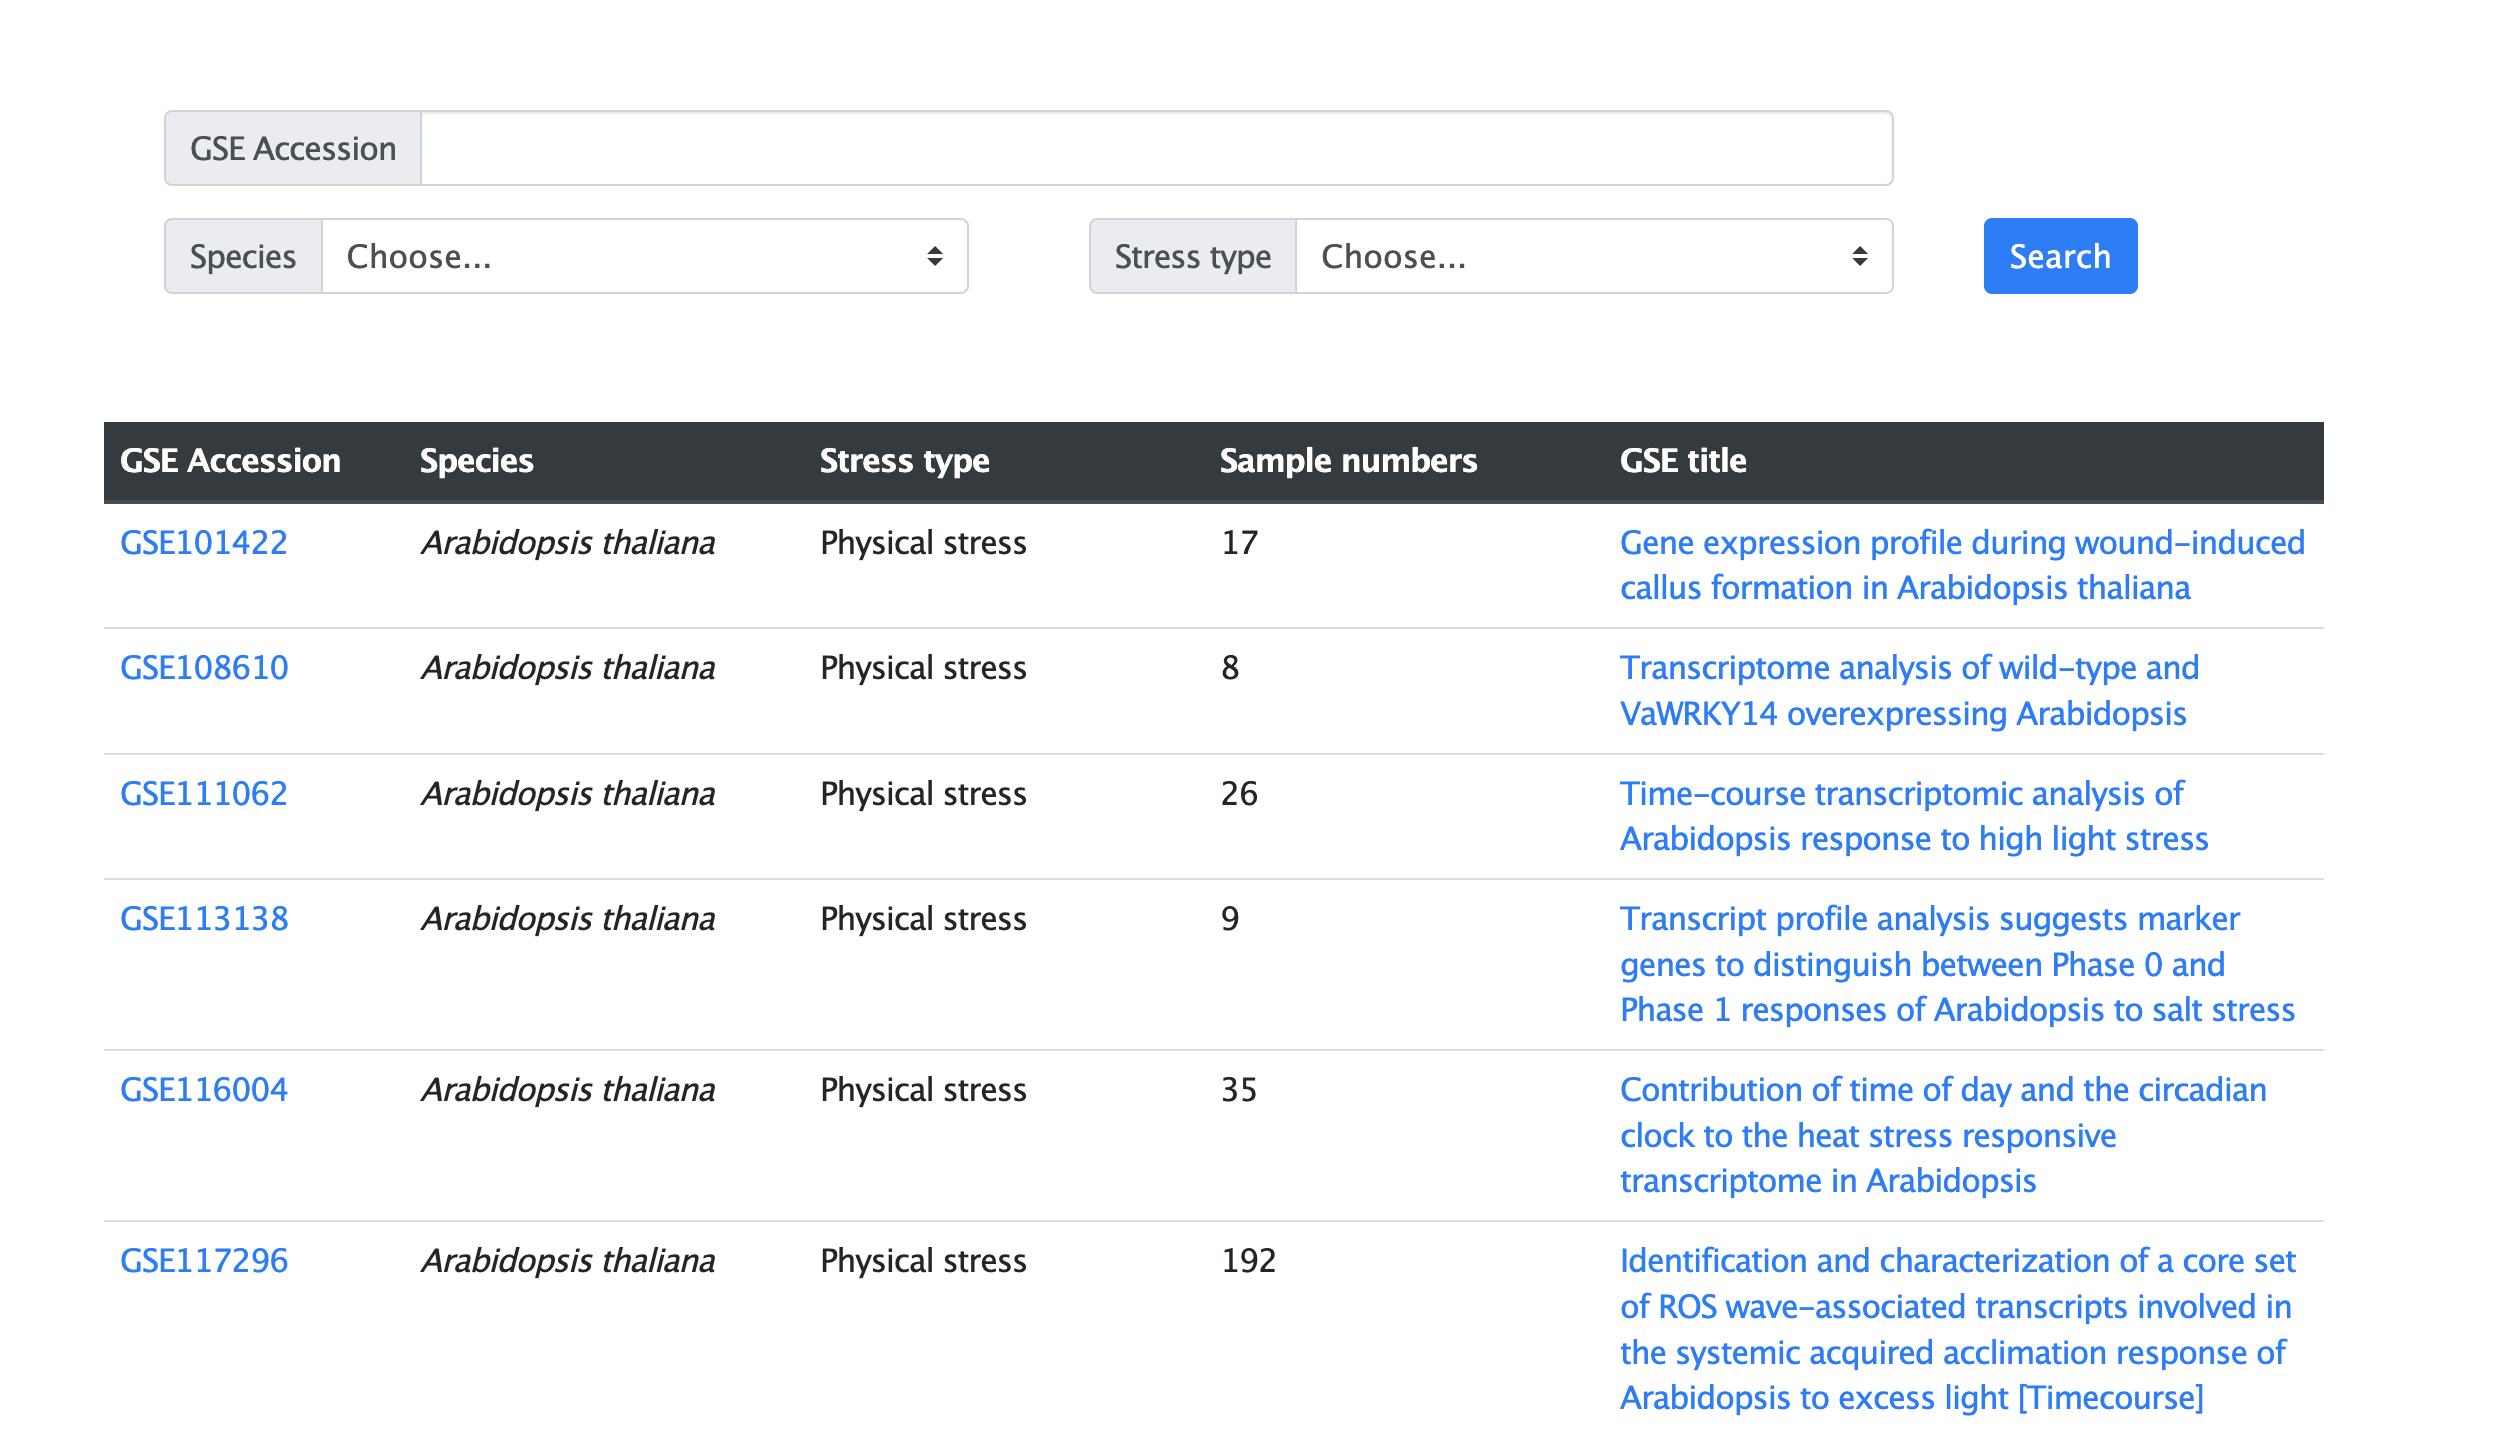
Figure 2.1 The browse web page
If users want to view the specific information of the RNA-seq data, they can click the corresponding GSE Accession Number to direct to the detailed information page (Figure 2.2). On the new page, detailed information about the specific RNA-seq data would be shown.

Figure 2.2 Detailed information of the RNA-seq data
3. How to search in Mip-mining database?
The search page allows users to search species, condition type, and the corresponding GSE Accession Number stored in the database.
The search function includes three types ways, users can choose one of them to search:
(1) Species search:
Users can choose species' name, for example, “Arabidopsis thaliana” or other species collected in the database to inquire the RNA-seq data (Figure 3.1).
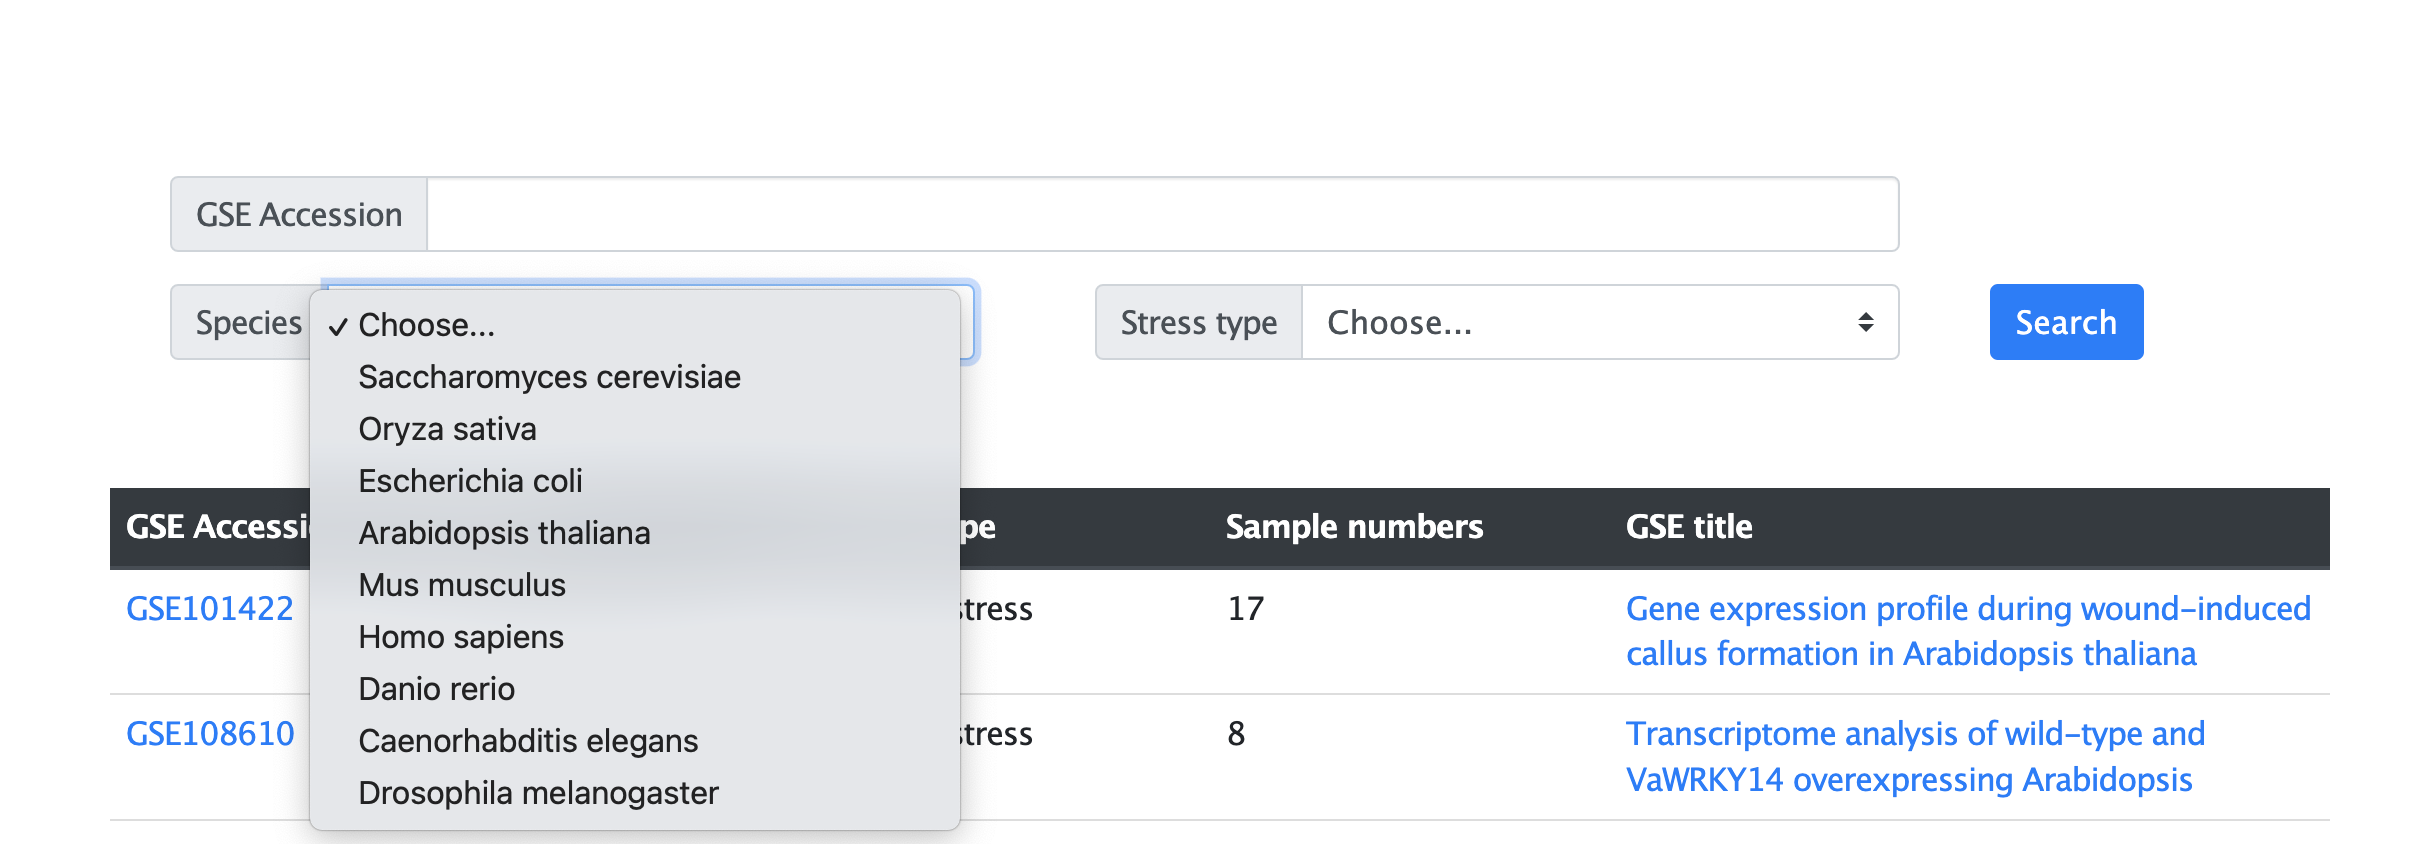
Figure 3.1 The search page by species
(2) Condition type search:
Users can choose the conditions they are interested in to search, such as Biological response, Physical stress, Chemical treatment, or other condition (Figure 3.2).
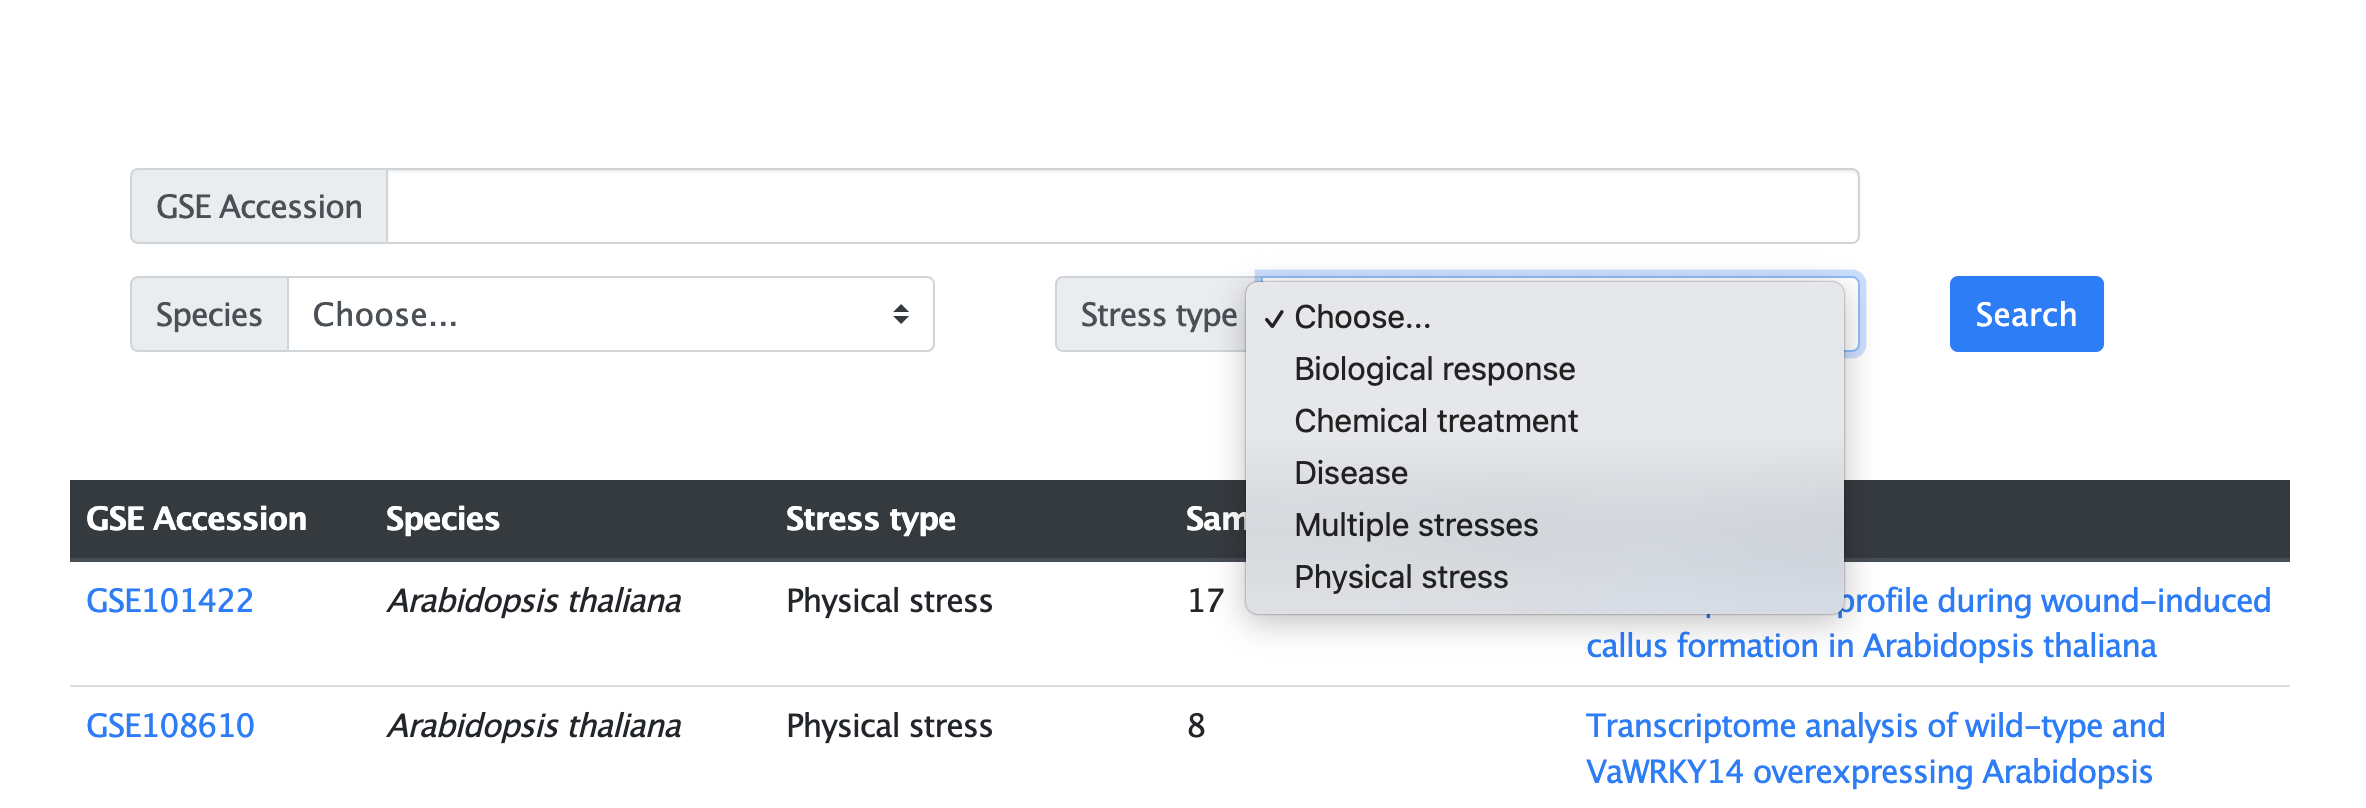
Figure 3.2 The search page by condition type
(3) GSE Accession search:
Users can specify GSE Accession number for their search, such as GSE21341.
4. How to analyze in Mip-mining database?
The website provides an interactive analysis page. Users can perform online analysis by uploading the phenotype file and selecting the threshold (Figure 4.1).

Figure 4.1 The analysis page under the specific RNA-seq data
(1) Upload the phenotype file:
Users need to determine the sample classification on the corresponding GEO page, and then upload the phenotype file in CSV format (Figure 4.2). Please ensure to upload the correct phenotype file, otherwise it will return error information. Users can also download the example phenotype file by clipping the 'example.csv' button.
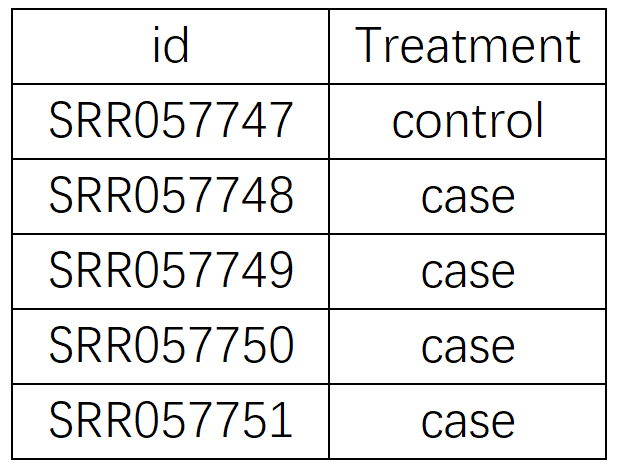
Figure 4.2 Example for the phenotype file of GSE21341
Note: SRR files are a format for storing sequencing data in the NCBI Sequence Read Archive (SRA), and they include a set of raw data and metadata information for a group of sequencing reads. One SRR accession represents one sample, and you can choose the samples that meet your criteria from the SRR sample list in the SRA database. We also provide the SRR accession list information on the submit page included in the sample_list.csv file.
Tips: How to make phenotype file corresponding to a certain GEO dataset?
First, you can search for a certain set of data in the GEO database, taking GSE21341 as an example. Typing GSE21341 on the GEO website and search.
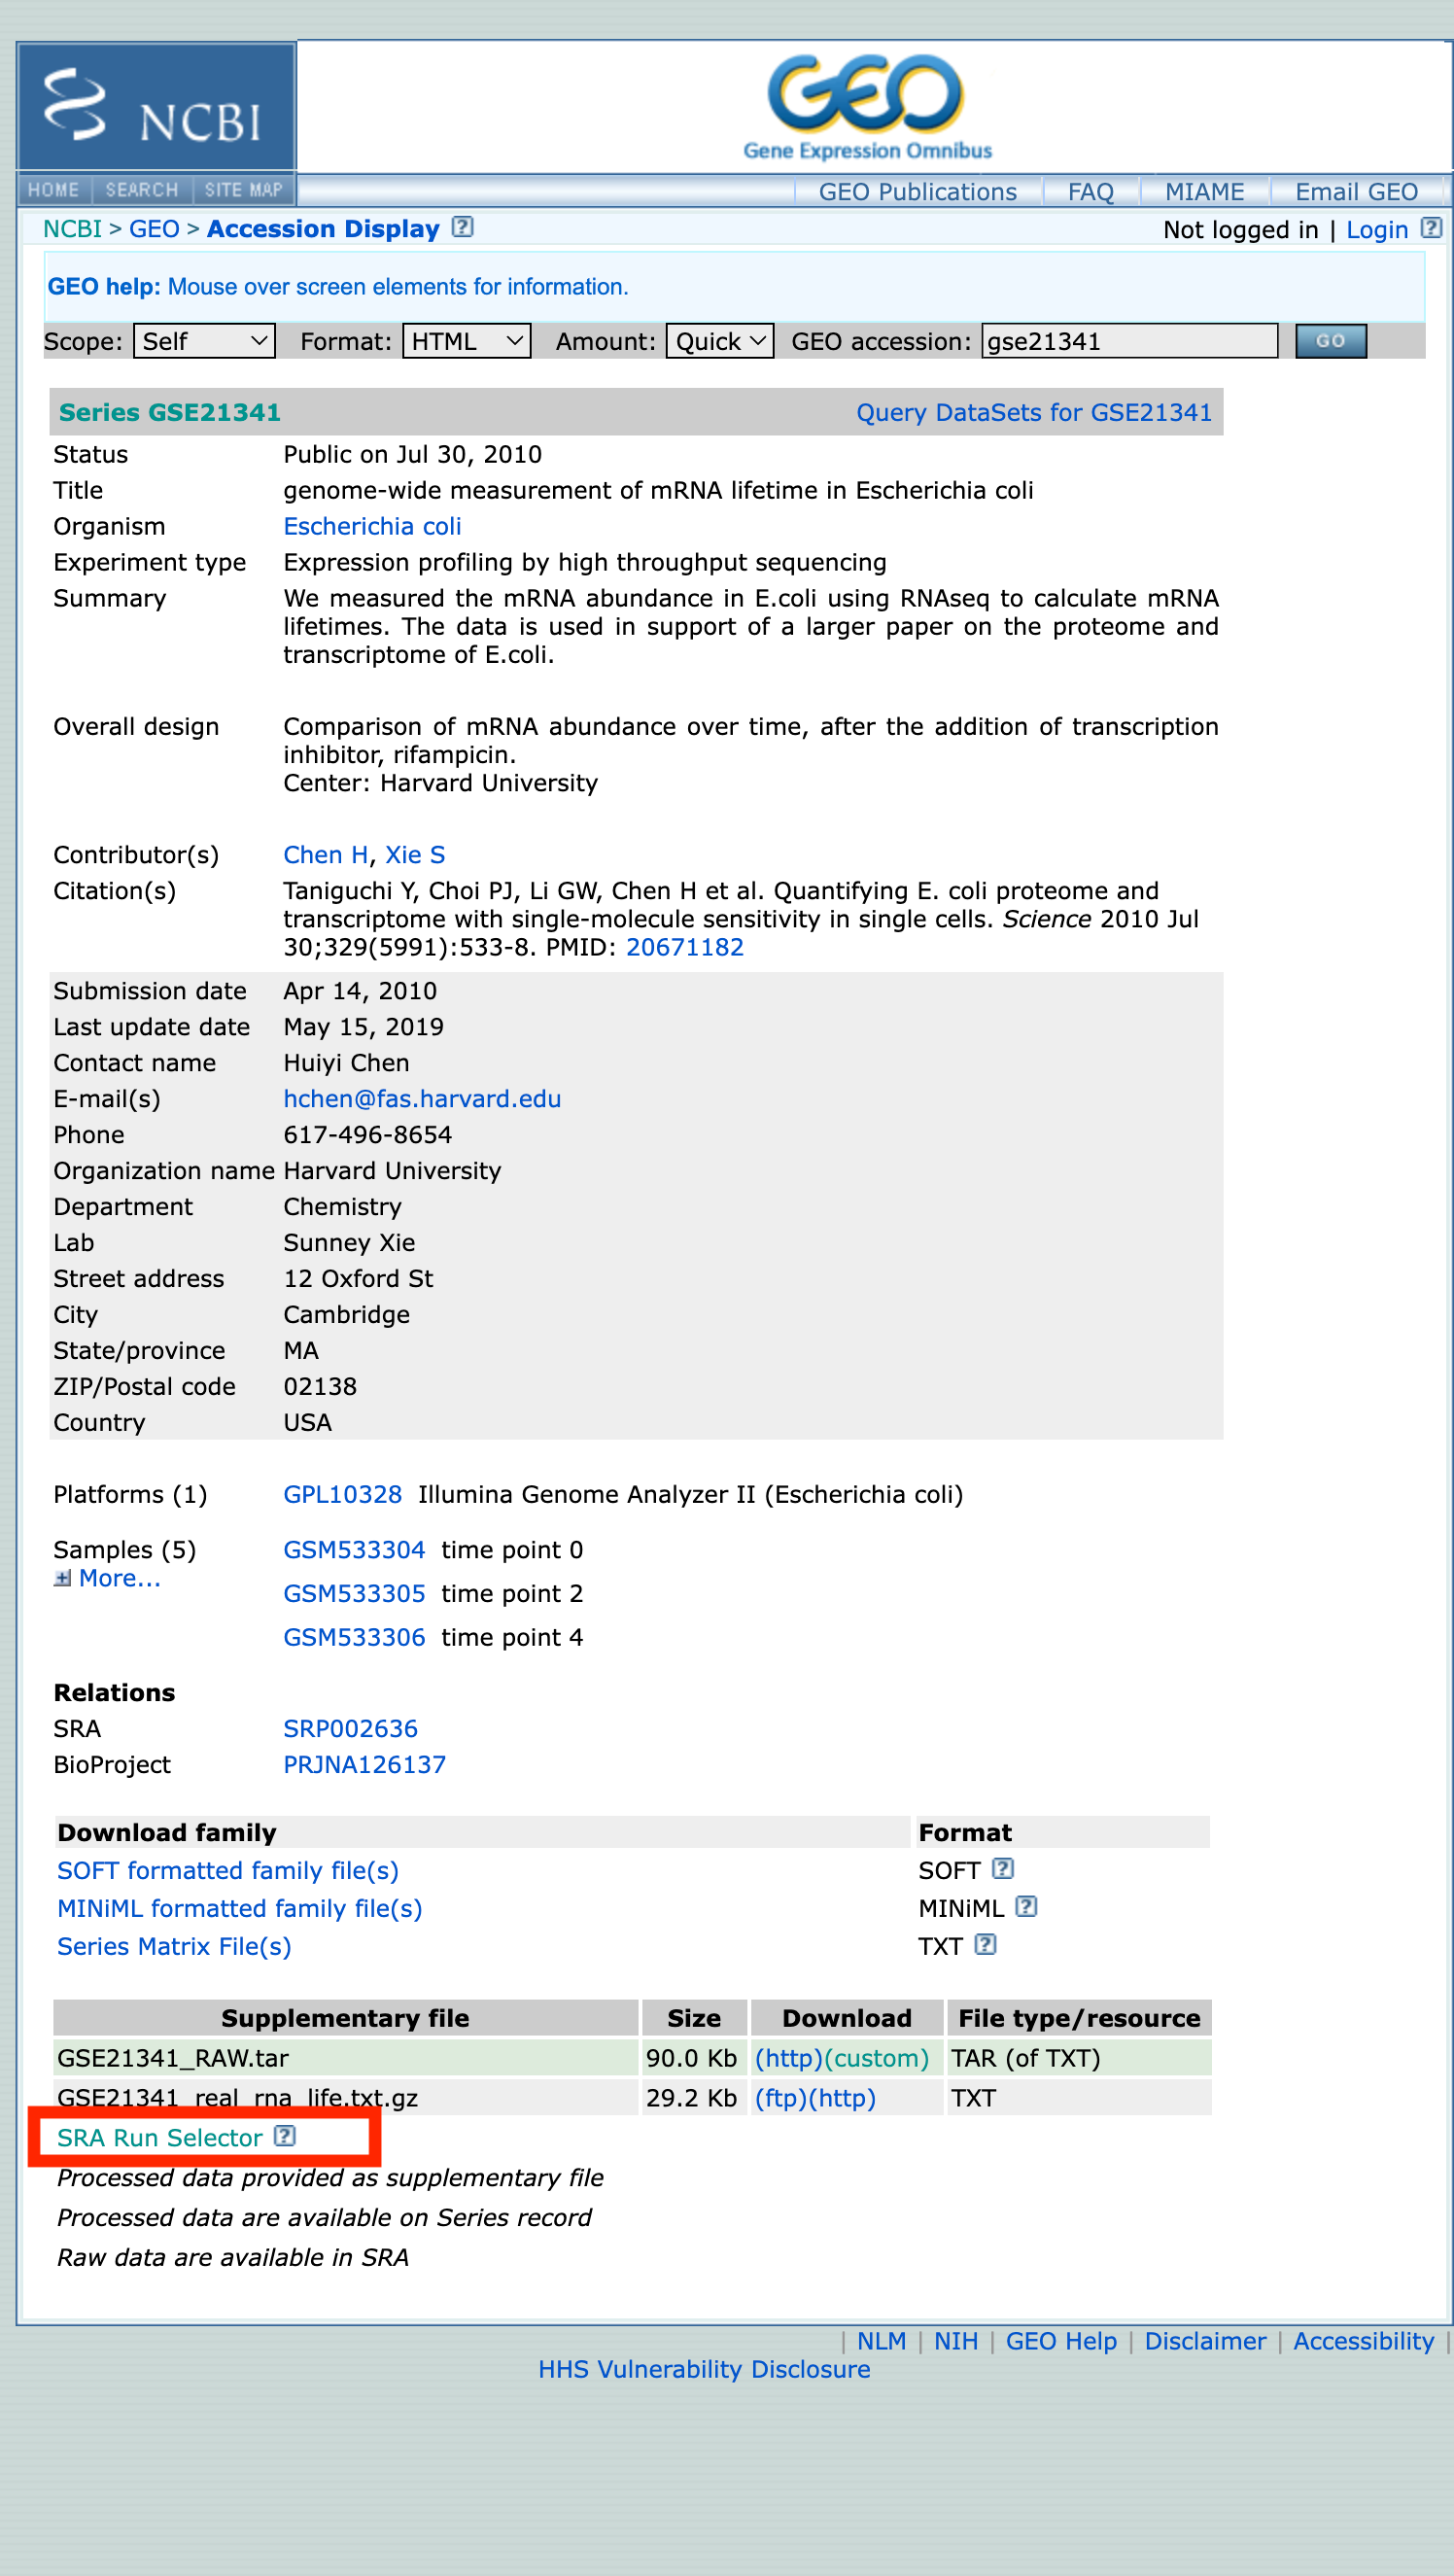
Figure 4.3 Search the GSE21341 results page on the GEO website
Then click the SRA Run Selector button to go to the page containing the list of SRR files. From this page, you can view the conditions of each SRR file to determine whether the phenotype is the experimental group or the control group.
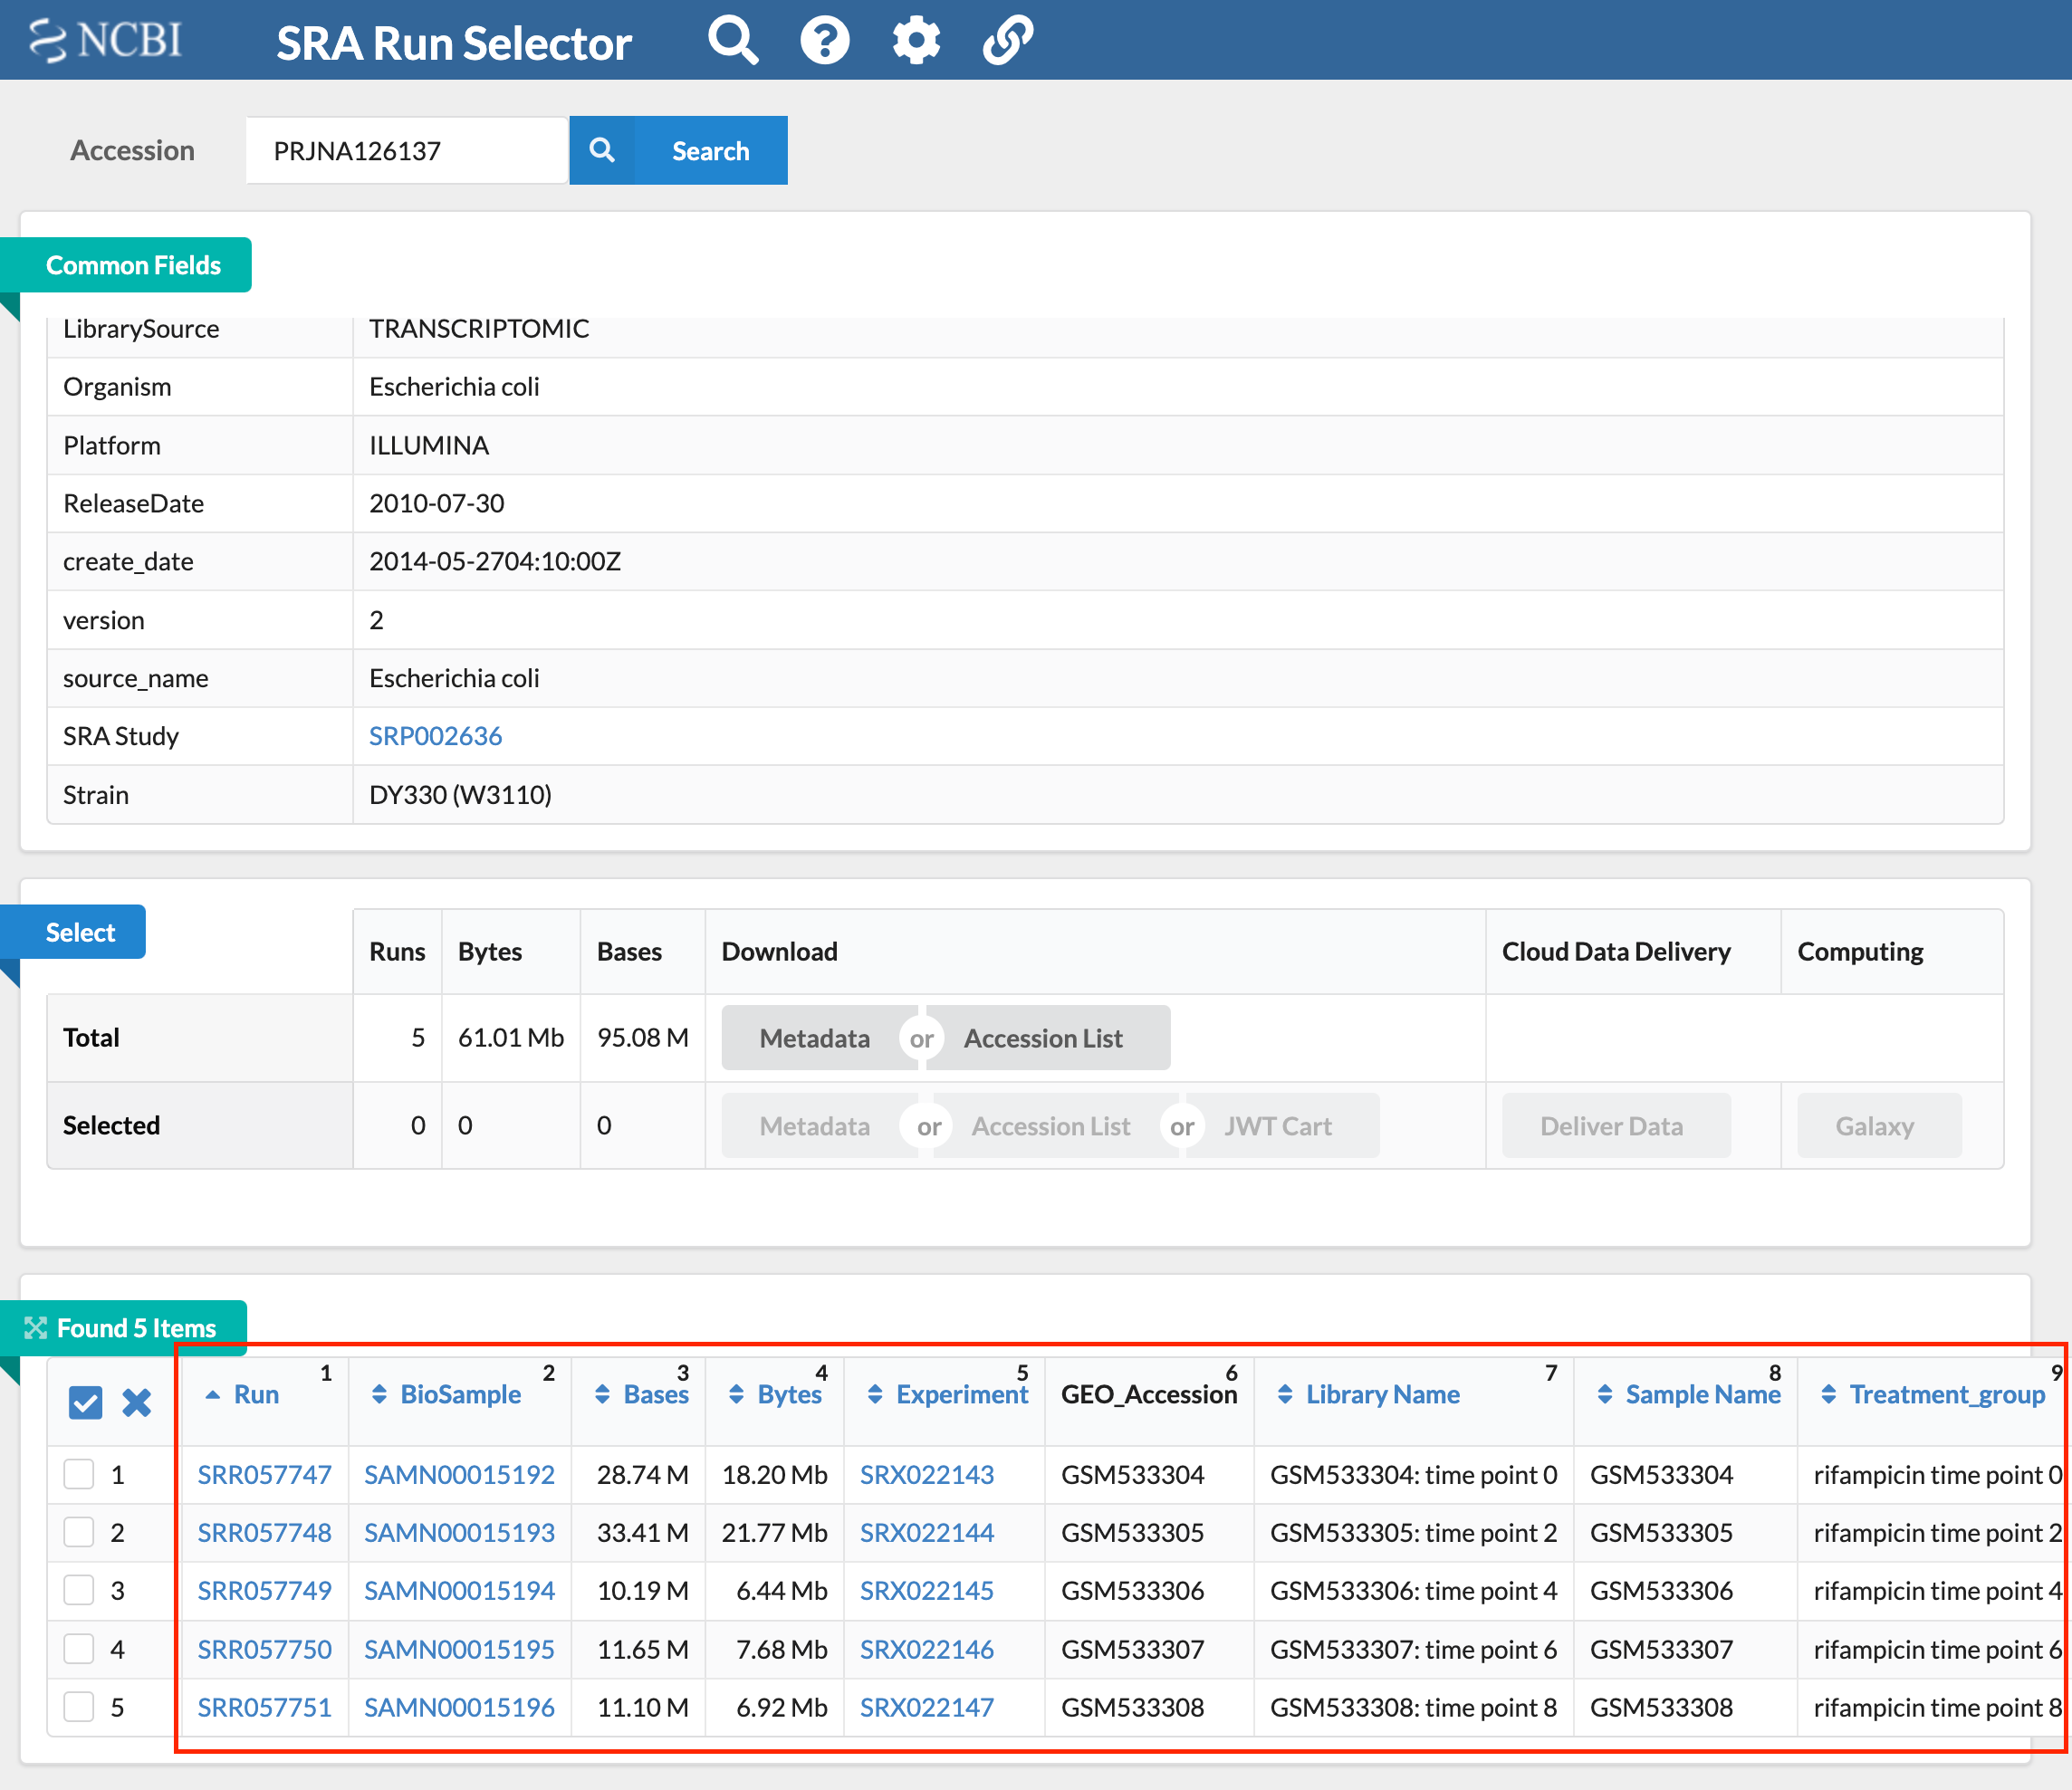
Figure 4.4 The results page that contains a list of SRR files
(2) Select threshold:
Users need to enter the p-value and log2 fold-change (log2FC) threshold to filter differentially expressed microproteins. Default parameters are log2FC 1.5, P-value 0.05.
(3) Submit:
When users finished the above steps, they can click the ‘submit’ button to start the personalized analysis.
5. Analysis results and download information
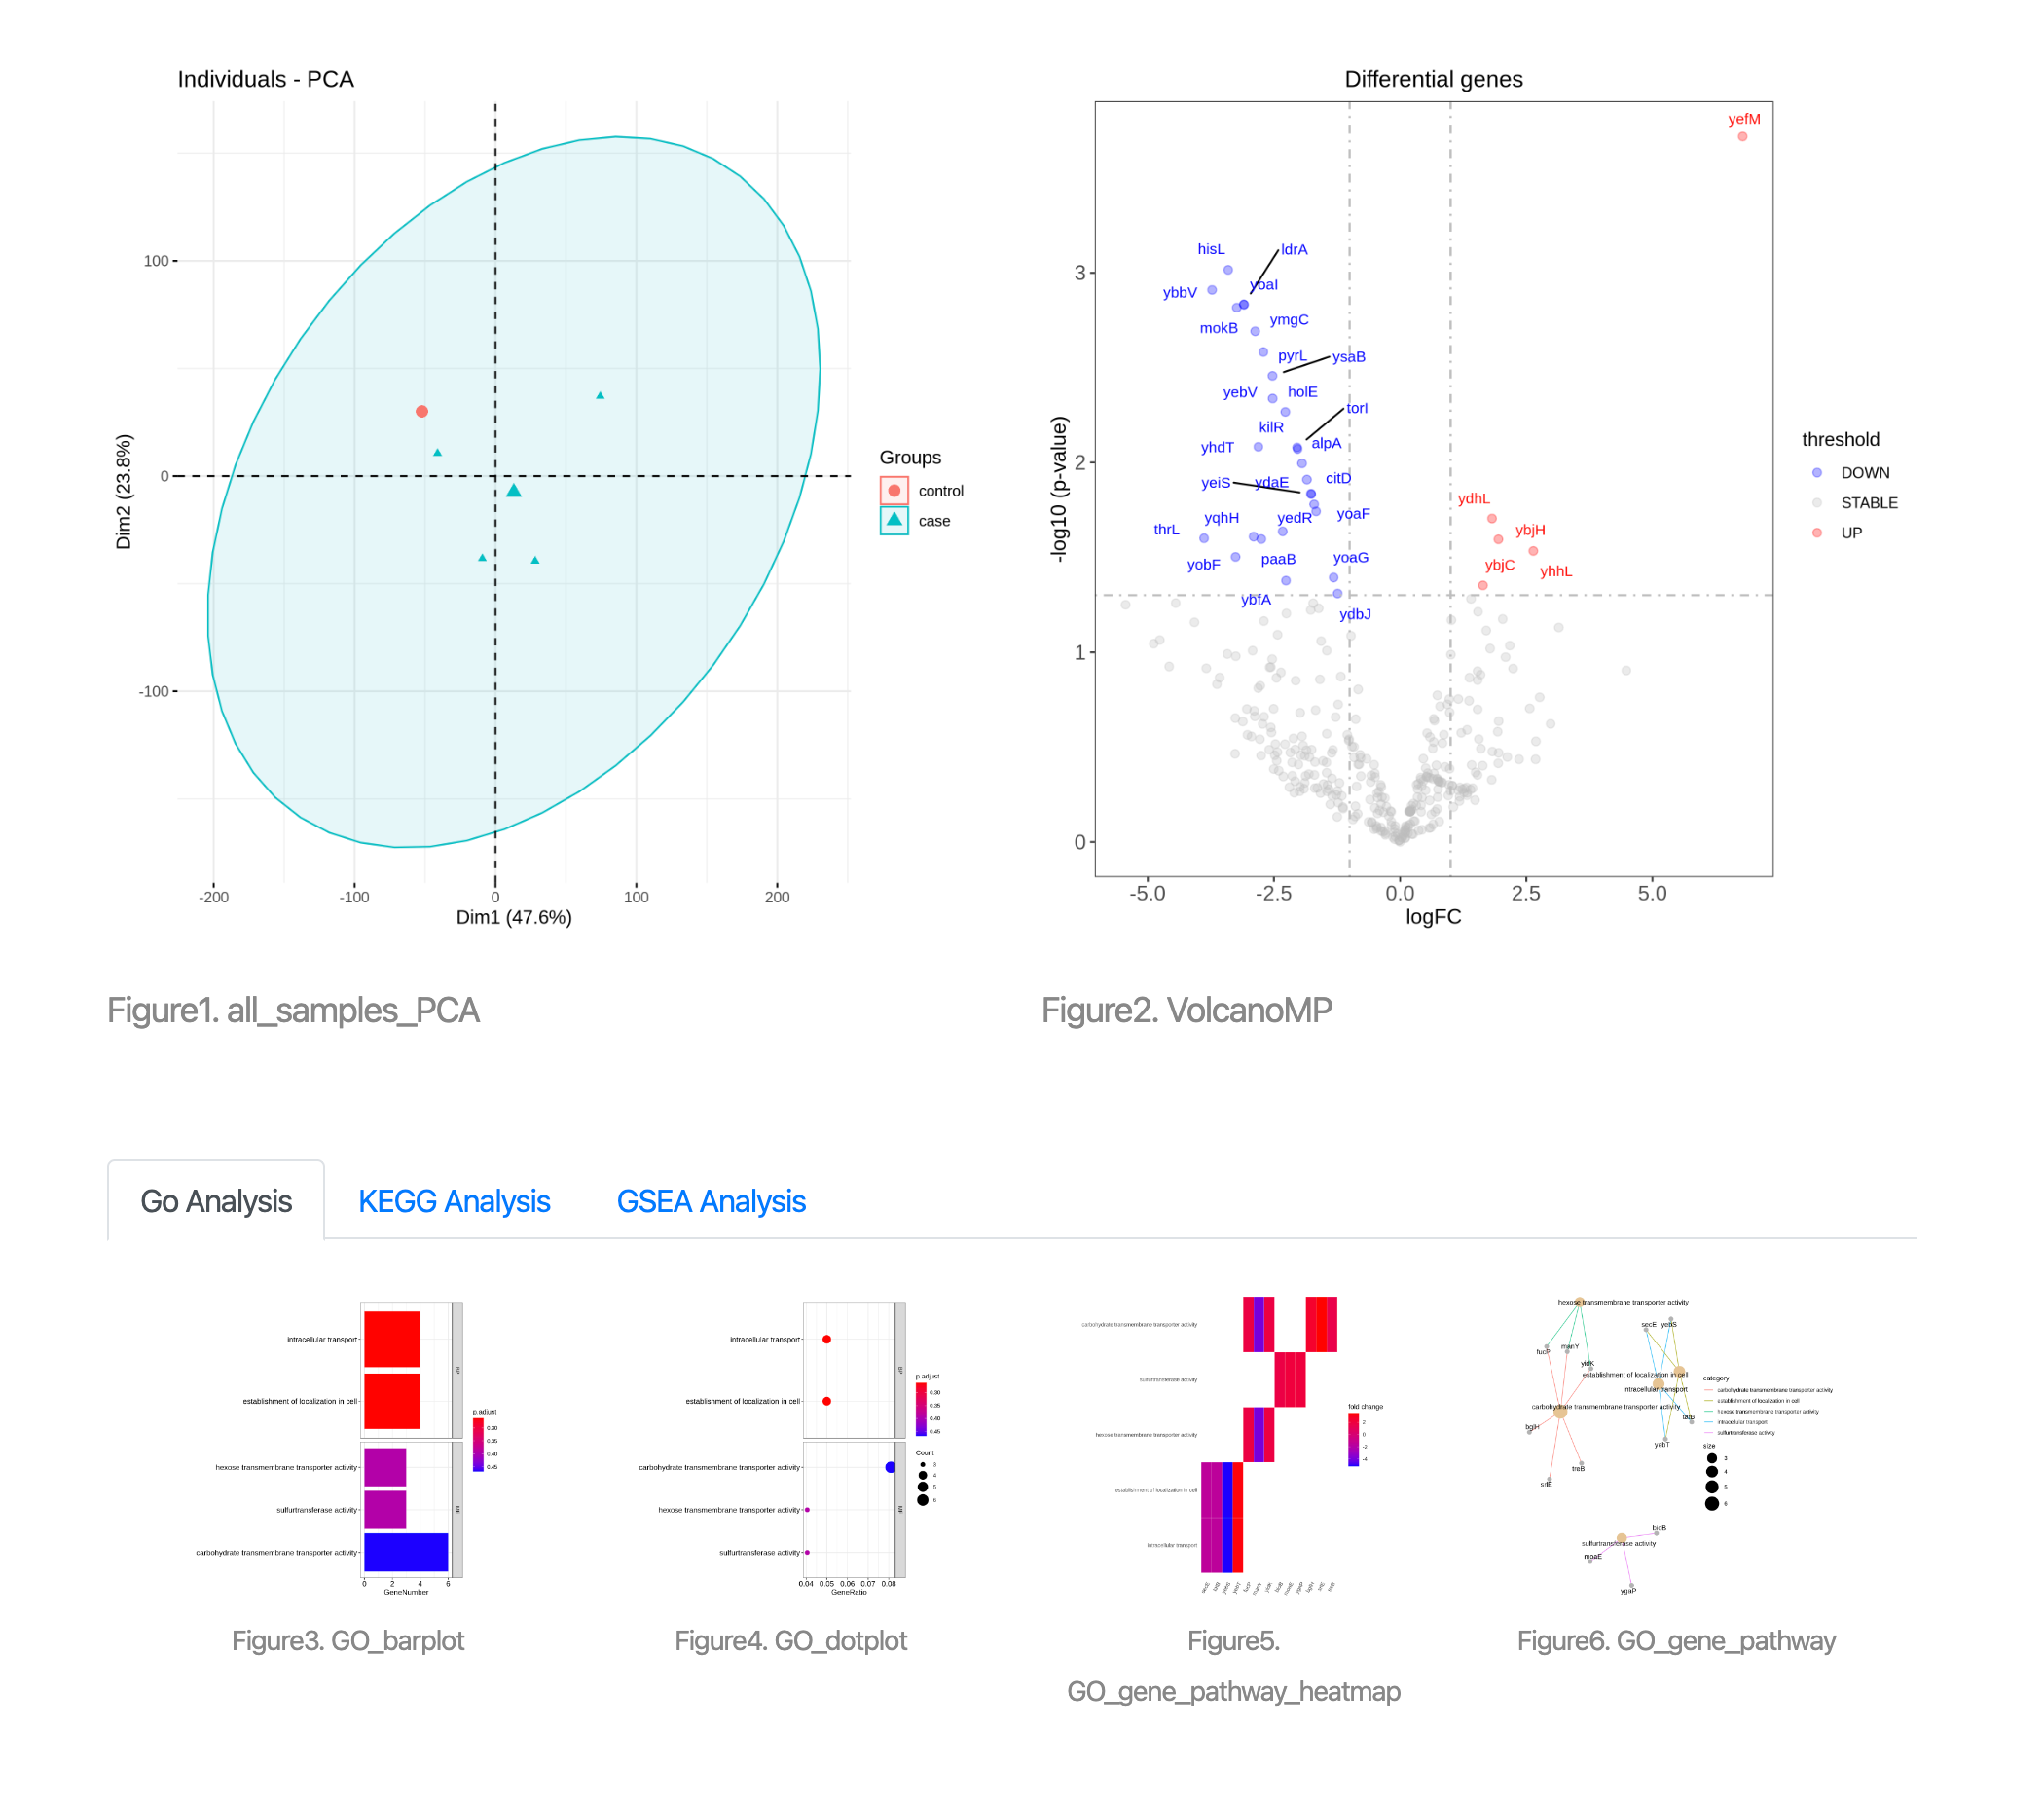
Figure 5.1 Result page
The result page contains sample distribution, differential expression analysis results, and enrichment analysis integrating GO, KEGG and GSEA parts. These results are described in detail below.

Figure 5.2 All_samples_PCA
Each sample represent a sample of GSE data.

Figure 5.3 VolcanoMP
The volcano plot shows fold change and p-value for a particular comparison (case versus control). The y-axis represents the p-value of genes. The x-axis represents the logFC of genes. The gray dashed line shows selected fold change and p-value cutoff. Microprotein genes at the selected logFC and p-value threshold are highlighted in red (indicate upregulation) and blue (indicate downregulation), respectively.
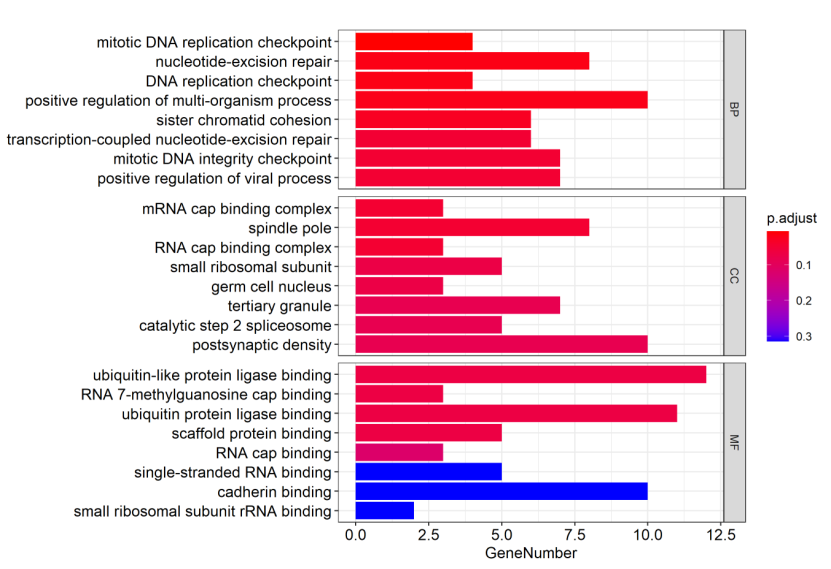
Figure 5.4 GO_barplot
The y-axis represents GO-enriched terms. The x-axis represents the genes’ number. The size of the bar represents the number of genes under a specific GO term. The BP (biological processes), CC (cellular component), MF (molecular function) GO terms are colored by the adjusted p-values.
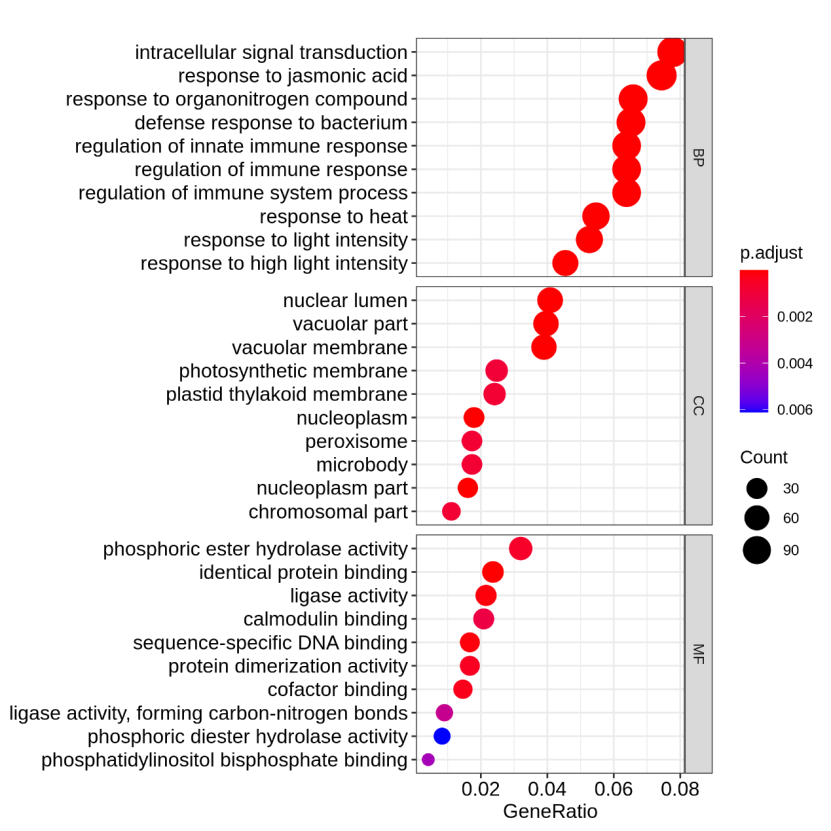
Figure 5.5 GO_dotplot
The y-axis represents GO-enriched terms. The x-axis represents the GeneRatio. The size of dots represents the number of genes under a specific term. The color of the dots represents the adjusted p-value.
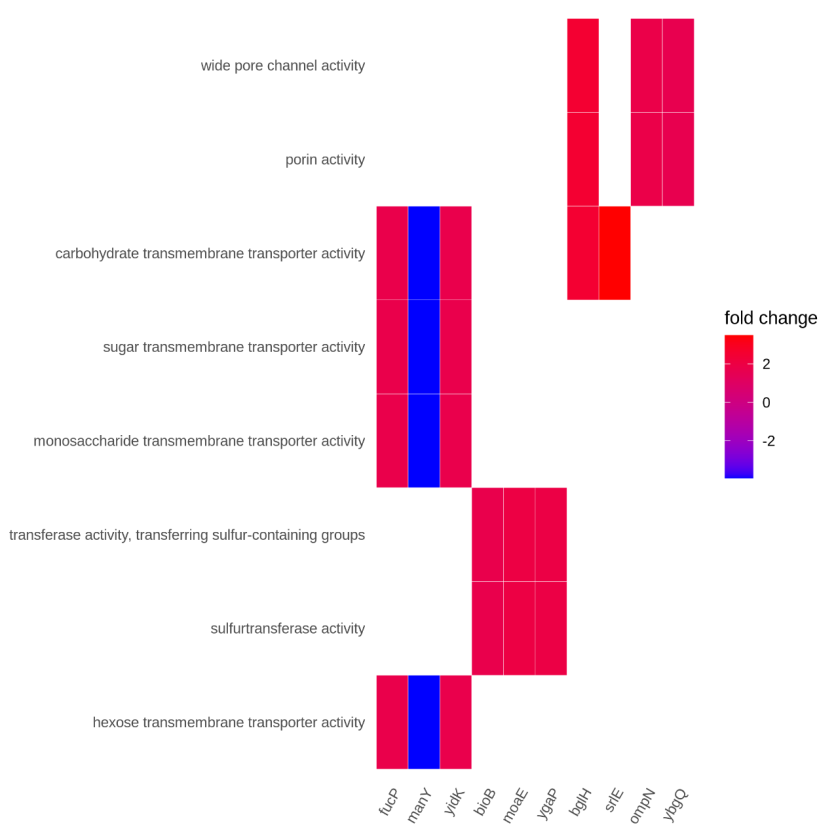
Figure 5.6 GO_gene_pathway_heatmap
The y-axis represents GO-enriched terms. The x-axis represents the gene name. The color represents the fold change.
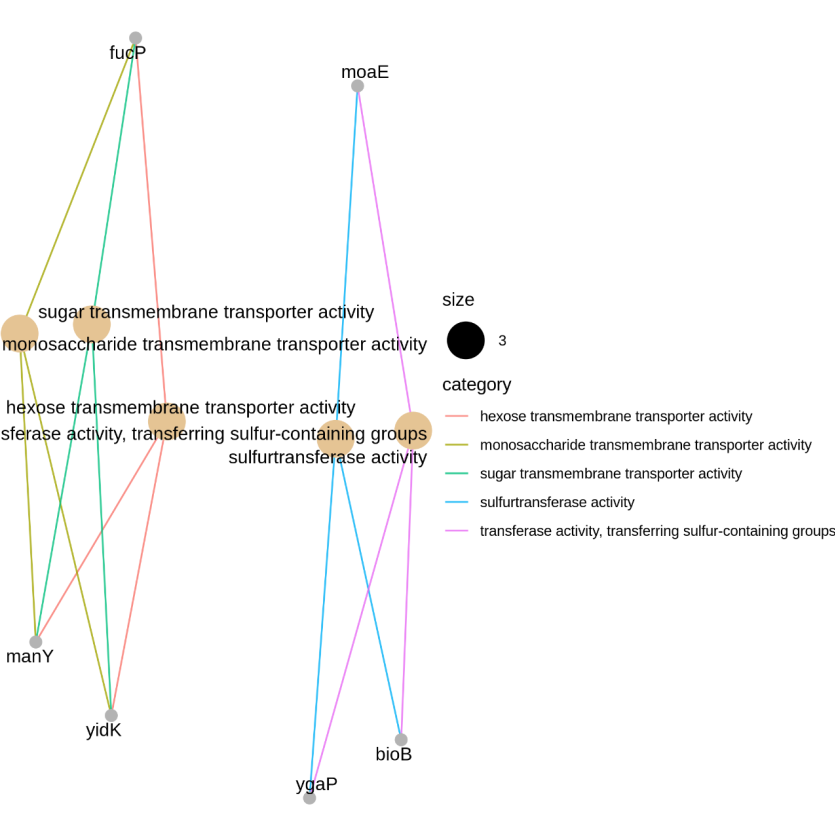
Figure 5.7 GO_gene_pathway
The nodes represent the significantly regulated DEGs. The edges represent the interaction between significantly regulated DEGs. DEGs: differentially expressed genes.
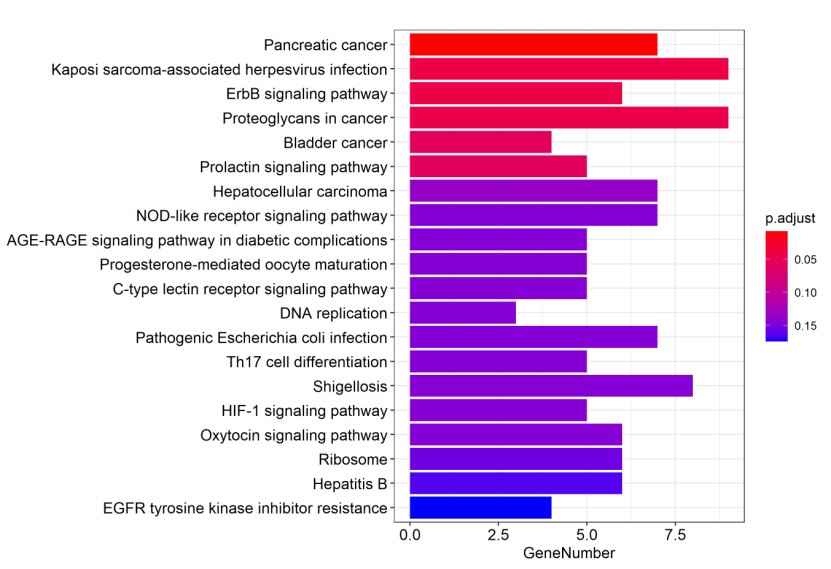
Figure 5.8 KEGG_barplot
The y-axis represents KEGG-enriched terms. The x-axis represents the genes’ number. The size of the bar represents the number of genes under a specific term. The KEGG terms are colored by the adjusted p-value.
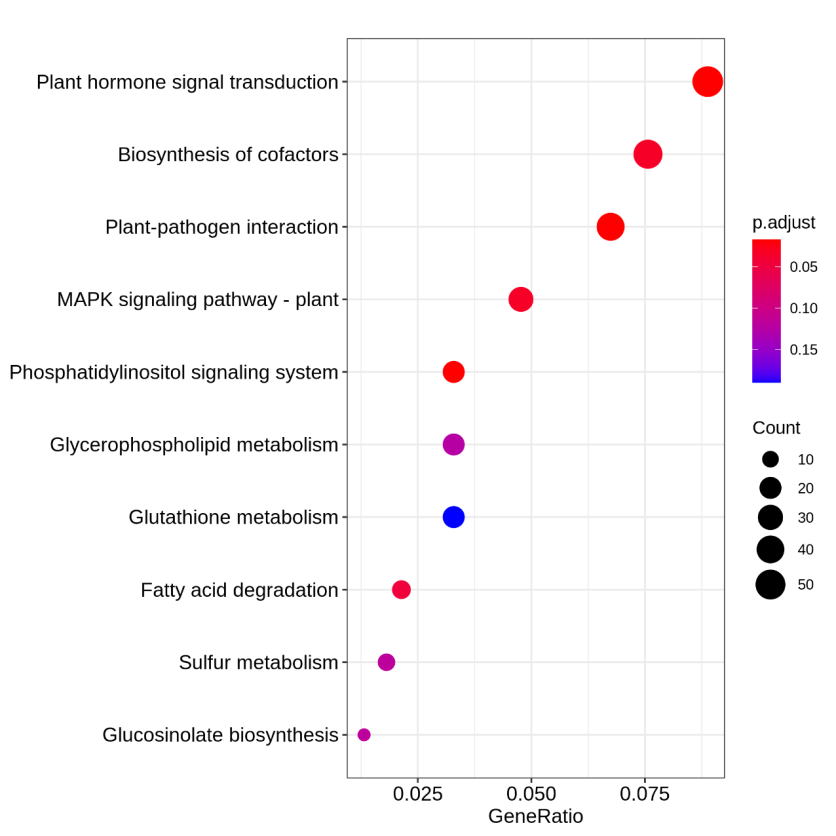
Figure 5.9 KEGG_dotplot
The y-axis represents KEGG-enriched terms. The x-axis represents the GeneRatio. The size of dots represents the number of genes under a specific term. The color of the dots represents the adjusted p-value.
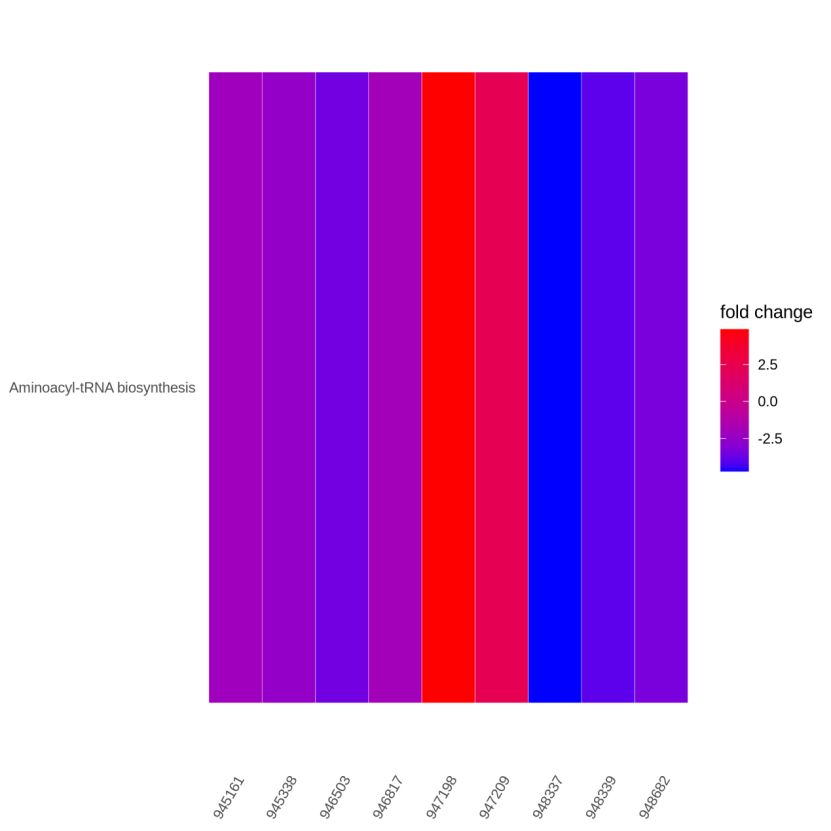
Figure 5.10 KEGG_gene_pathway_heatmap
The y-axis represents KEGG-enriched terms. The x-axis represents the ncbi-gene ID. The color represents the fold change.
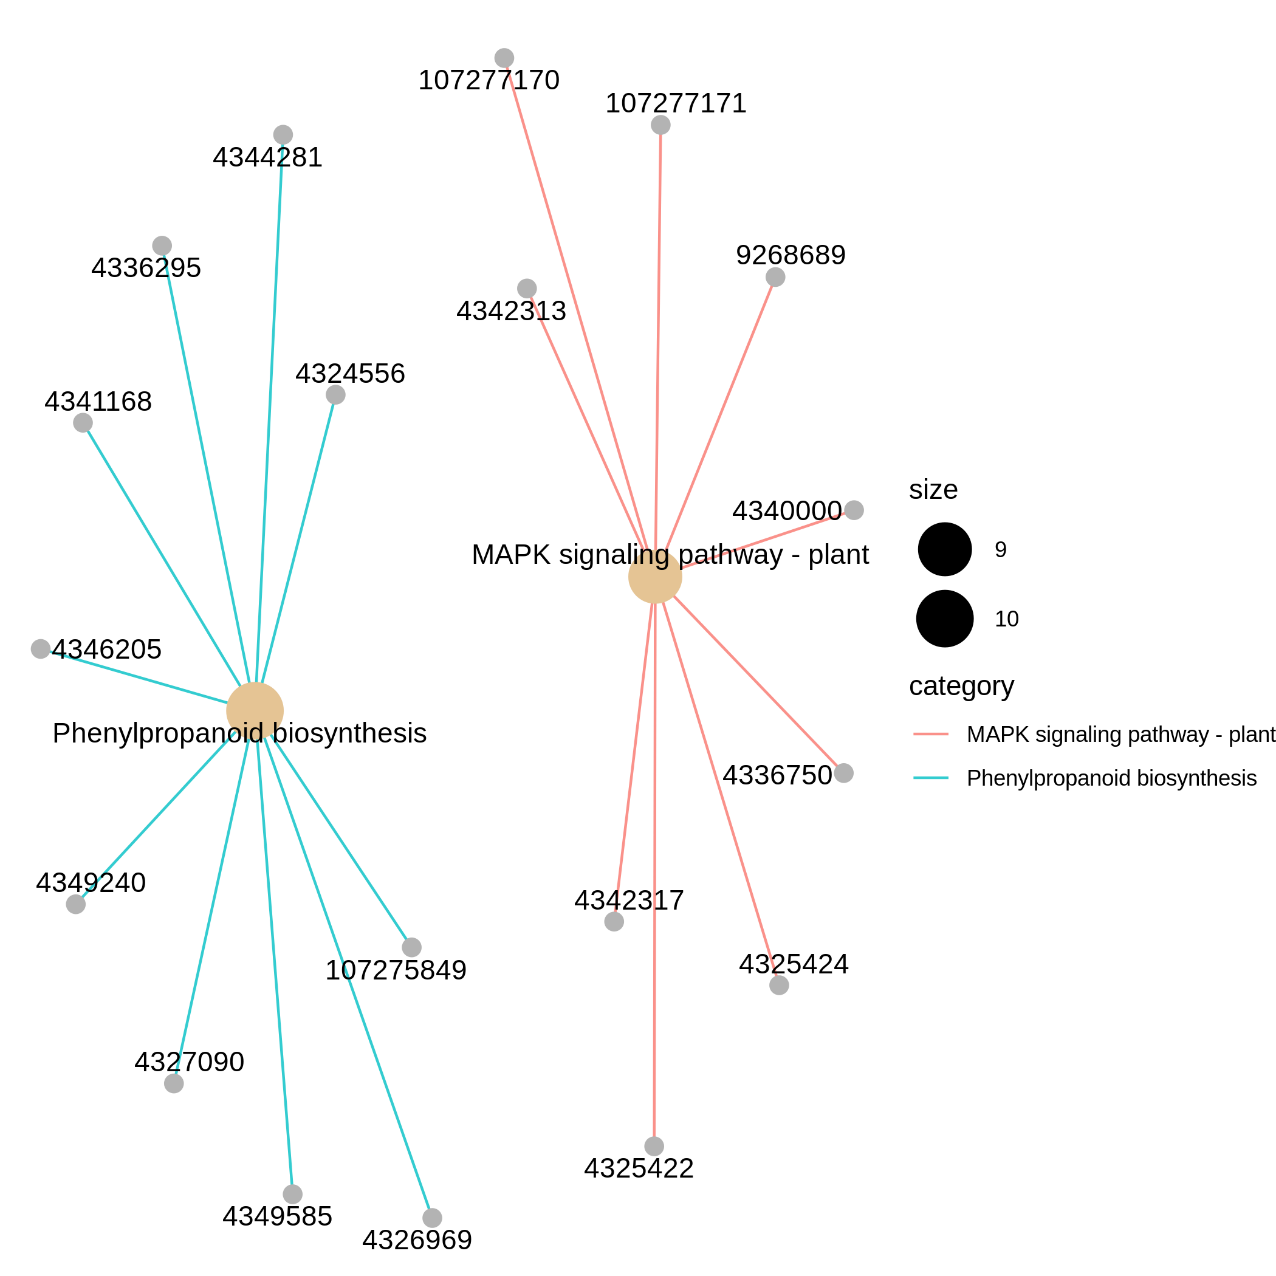
Figure 5.11 KEGG_gene_pathway
The nodes represent the significantly regulated DEGs (ncbi-geneid). The edges represent the interaction between significantly regulated DEGs. DEGs: differentially expressed genes.
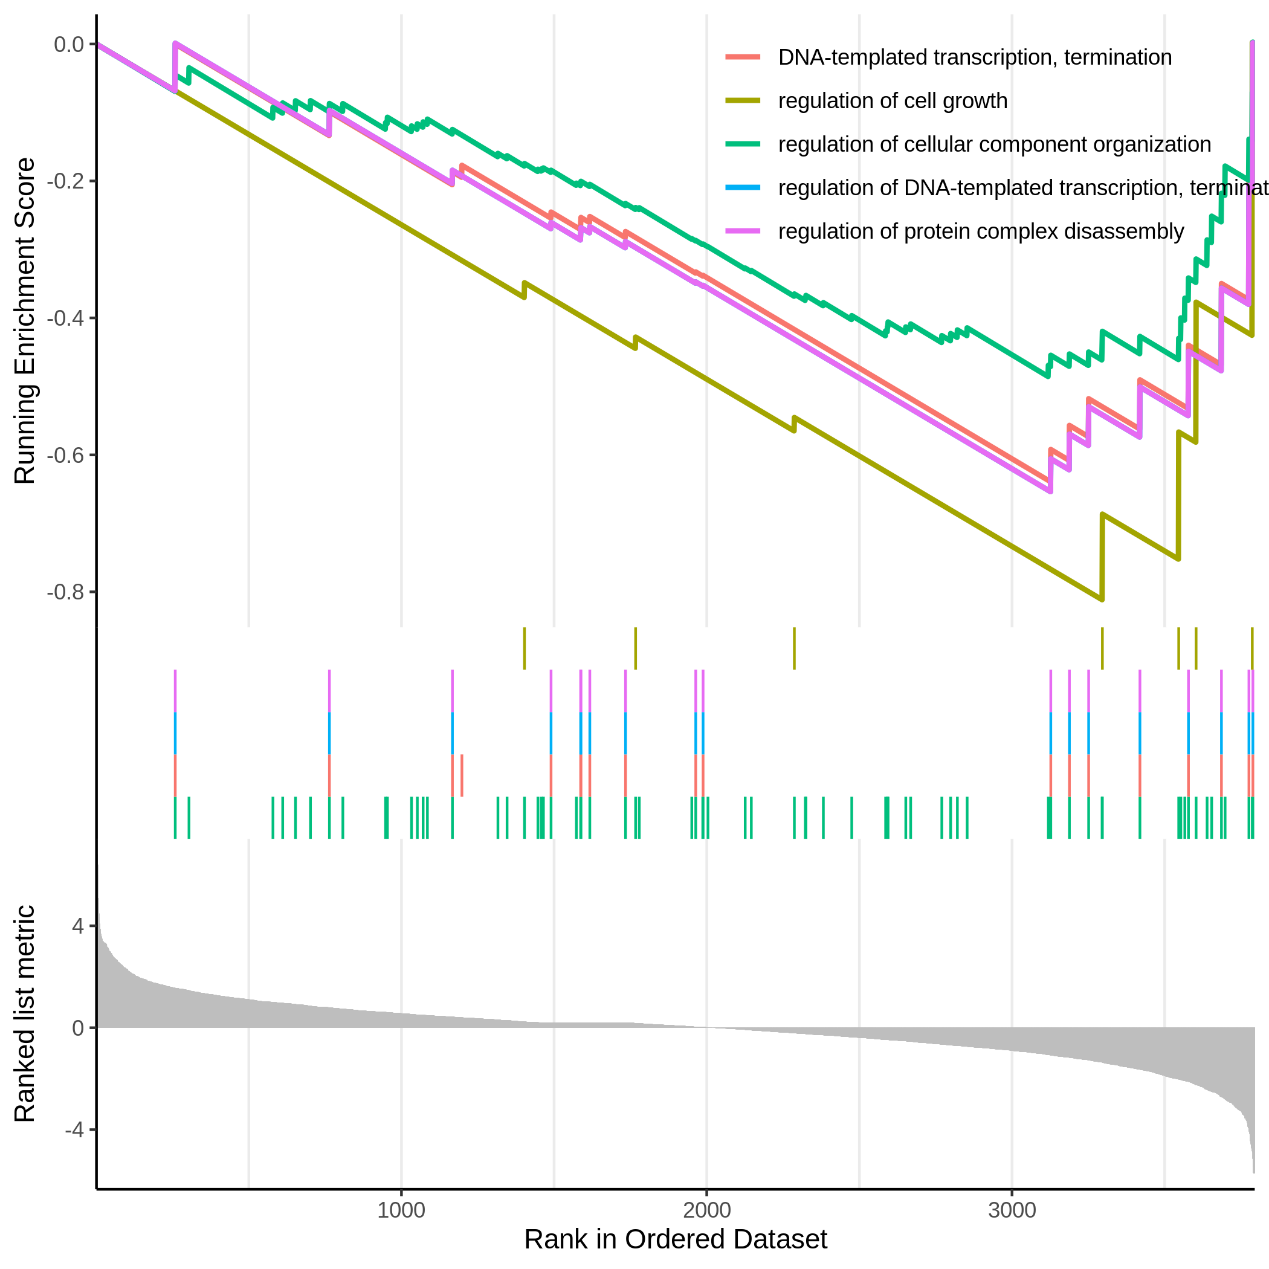
Figure 5.12 EnrichGO_gseaplot
Each line representing one particular gene set with unique color and the display limit is 5. Only gene sets with FDR q < 0.05 were considered significant.
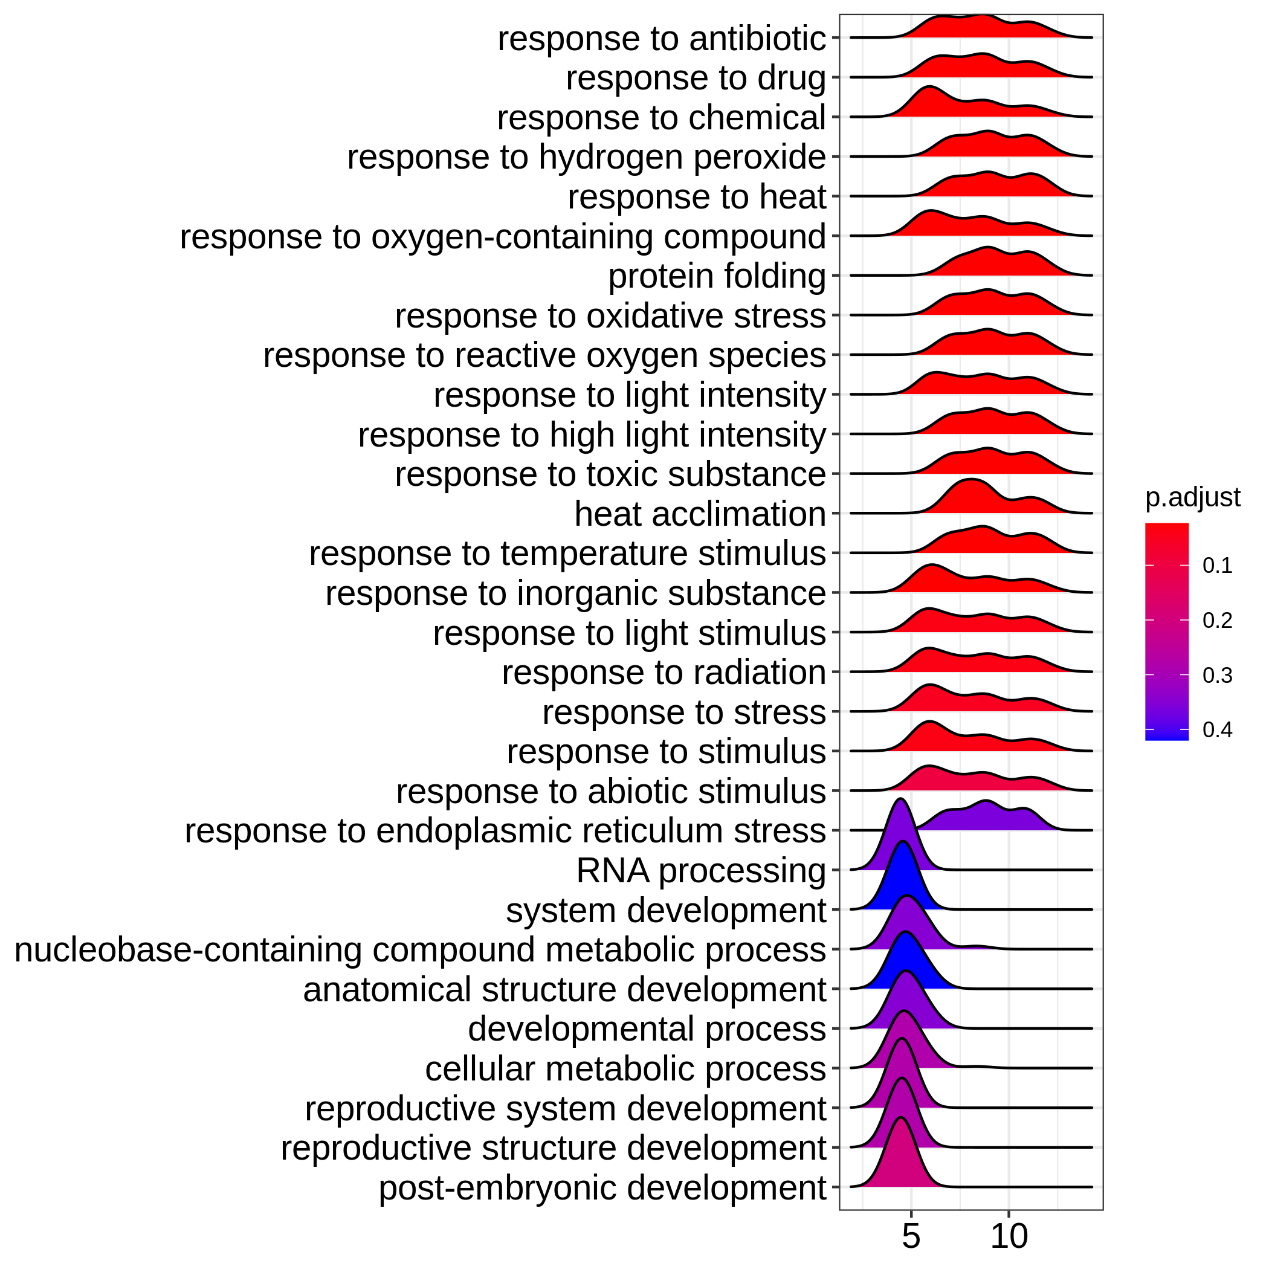
Figure 5.13 EnrichGO_ ridgeplot
Grouped by gene set, density plots are generated by using the frequency of fold change values per gene within each set. The color of the peaks represents the adjusted p-value.
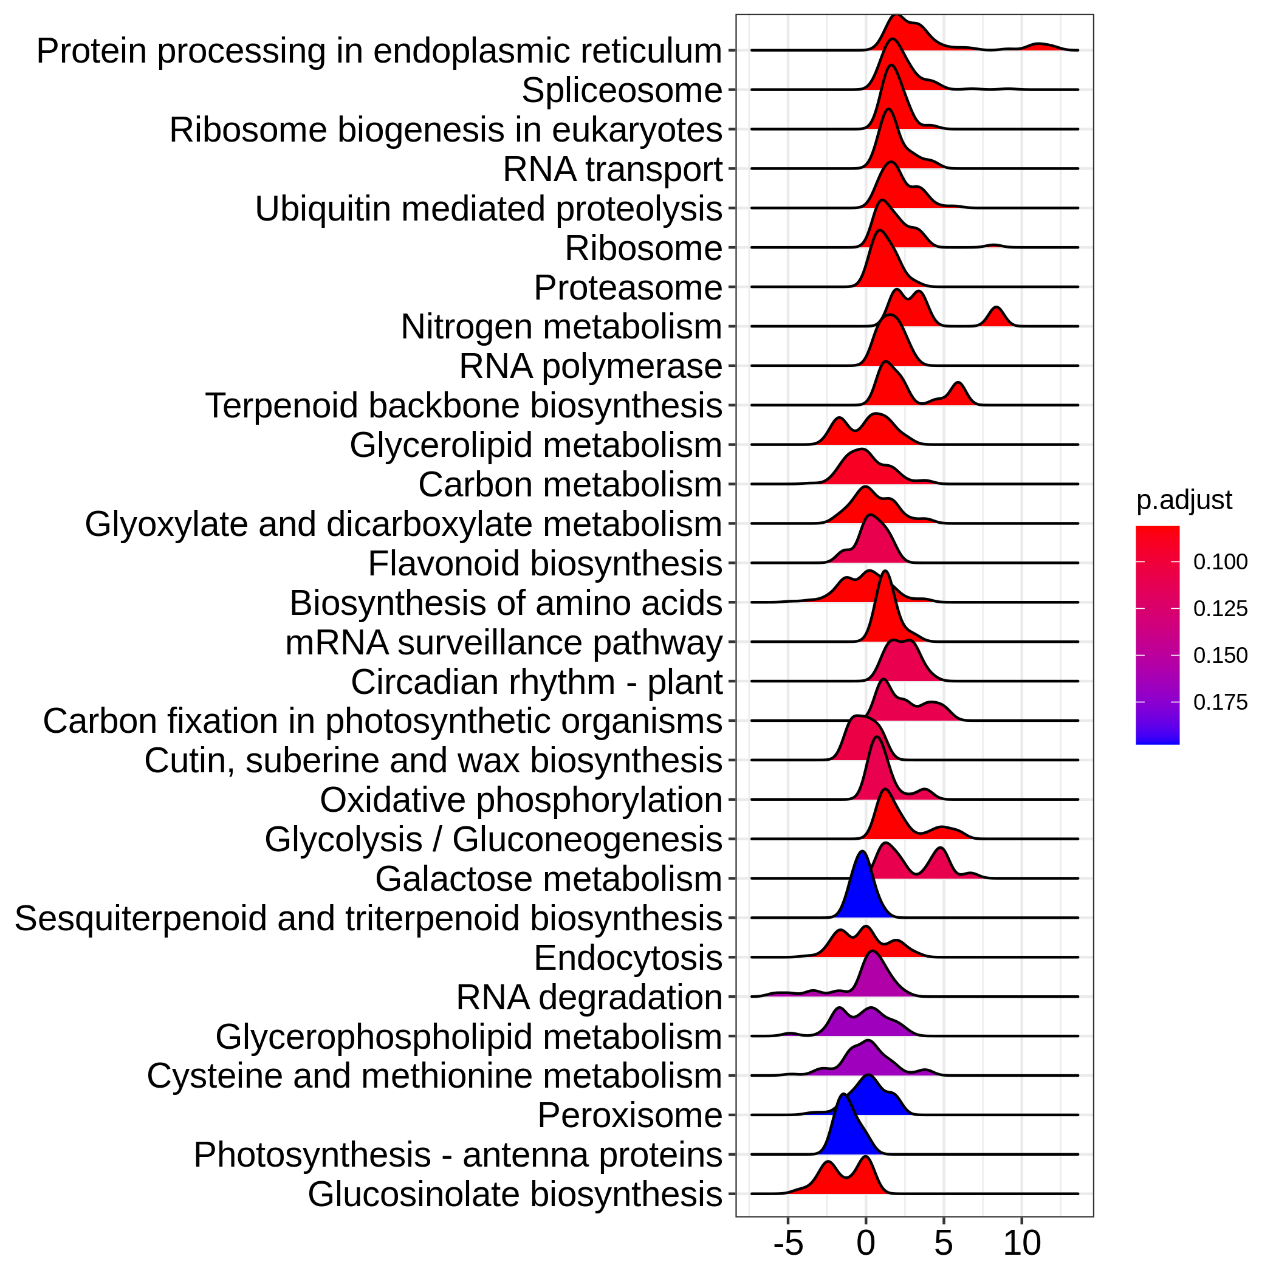
Figure 5.14 EnrichKEGG_ridgeplot
Grouped by gene set, density plots are generated by using the frequency of fold change values per gene within each set. The color of the peaks represents the adjusted p-value.
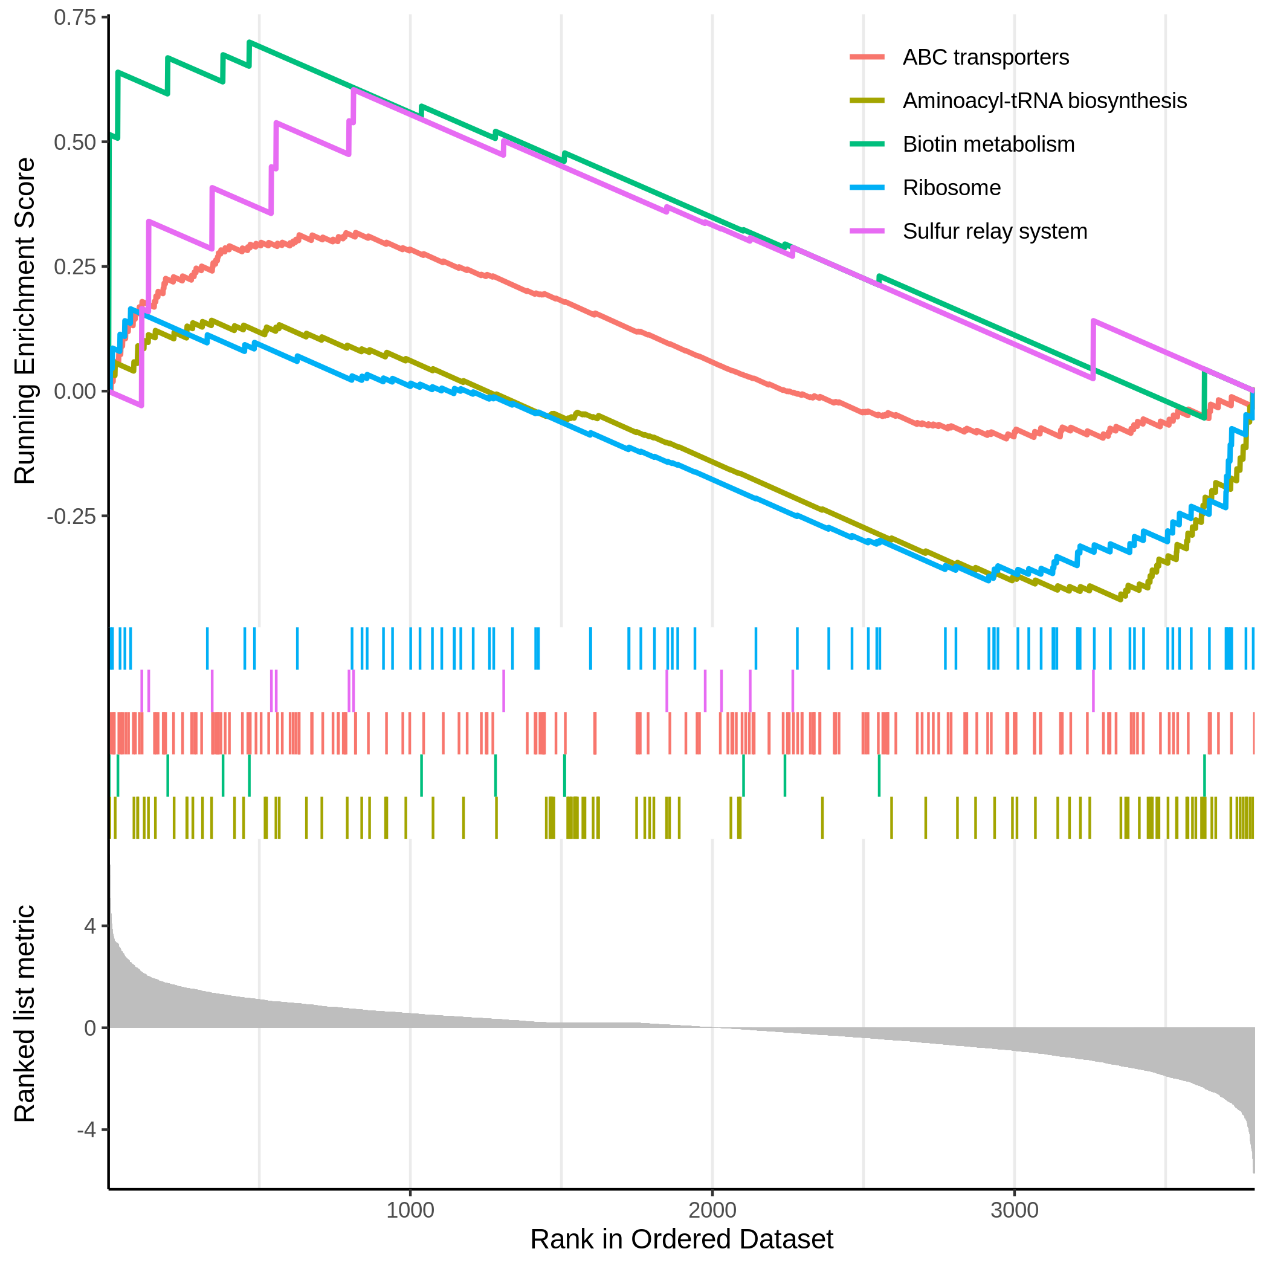
Figure 5.15 EnrichKEGG_gseaplot
Each line representing one particular gene set with unique color and the display limit is 5. Only gene sets with FDR q < 0.05 were considered significant.
Table 1. Microprotein_results.csv
ID: the microprotein gene names
Log2FC: estimate of the log2-fold-change corresponding to the contrast (case vs control)
AveExpr: average log2-expression for the sample
T.statistic: moderated t-statistic
P.value: raw p-value
Adj.P.val: adjust corrected p-value
Log.odds: log-odds that the gene is differentially expressed
Group: gene label indicates up-regulation or down-regulation or stabilization of microprotein
Table 2. GO_results
ONTOLOGY: Three categories of functions subordinate to GO (MF: molecular function, CC: cellular component, BP: biological process)
ID: enriched GO terms
Description: GO function description
GeneRatio: The ratio of the number of genes annotated to the corresponding GO to the total number of genes with GO annotations
BgRatio: The ratio of the number of genes related to the Term among all (bg) genes to all (bg) genes.
pvalue: statistically significant level of enrichment analysis, under normal circumstances, p-value <0.05 this function is an enrichment item
p.adjust: adjust corrected p-value
qvalue: the q value for statistical testing of the p-value
geneID: the gene names annotated to the corresponding GO term
Count: the number of genes annotated to the corresponding GO term
Table 3. KEGG_results
ID: enriched KEGG terms
Description: KEGG function description
GeneRatio: The ratio of the number of genes annotated to the corresponding KEGG to the total number of genes with KEGG annotations
BgRatio: The ratio of the number of genes related to the Term among all (bg) genes to all (bg) genes.
pvalue: statistically significant level of enrichment analysis, under normal circumstances, p-value <0.05 this function is an enrichment item
p.adjust: adjust corrected p-value
qvalue: the q value for statistical testing of the p-value
geneID: the gene names annotated to the corresponding KEGG term
Count: the number of genes annotated to the corresponding KEGG term